Transcription of Labcoat Leni’s Real Research
1 DISCOVERING STATISTICS USING spss Chapter 9: The linear model (regression). Labcoat Leni's Real Research Why do you like your lecturers? Problem Chamorro Premuzic, T., et al. (2008). Personality and Individual Differences, 44, 965 976. In the previous chapter we encountered a study by Chamorro Premuzic et al. in which they measured students' personality characteristics and asked them to rate how much they wanted these same characteristics in their lecturers. In that chapter we correlated these scores; however, we could go a step further and see whether students' personality characteristics predict the characteristics that they would like to see in their lecturers. The data from this study are in the file Chamorro Labcoat Leni wants you to carry out five multiple regression analyses: the outcome variables in each of the five analyses are the ratings of how much students want to see neuroticism, extroversion, openness to experience, agreeableness and conscientiousness.
2 For each of these outcomes, force age and gender into the analysis in the first step of the hierarchy, then in the second block force in the five student personality traits (neuroticism, extroversion, openness to experience, agreeableness and conscientiousness). For each analysis create a table of the results. Solution Lecturer Neuroticism The first regression we'll do is whether students want lecturers to be neurotic. Define the two blocks as follows. In the first block put Age and Gender (I ran this analysis on a Mac, so the screenshots will look a little different from the rest of the book, but they are basically the same): PROFESSOR ANDY P FIELD 1 DISCOVERING STATISTICS USING spss In the second, put all of the student personality variables (five variables in all): Set the options as in the book chapter. The main output (I haven't reproduced it all, but you can find it in the file Charmorro . ), is as follows: PROFESSOR ANDY P FIELD 2 DISCOVERING STATISTICS USING spss PROFESSOR ANDY P FIELD 3 DISCOVERING STATISTICS USING spss You could report these results as follows: B SE B step 1 Constant Age.
3 11* Gender .12* step 2 Constant Age .12* Gender .10 Neuroticism .06 Extroversion .08 PROFESSOR ANDY P FIELD 4 DISCOVERING STATISTICS USING spss Openness .12* Agreeableness .07 Conscientiousness .16* Note: R2 = .03 for step 1; R2 = .04 for step 2 (p < .05). * p < .05. So basically, age, openness and conscientiousness were significant predictors of wanting a neurotic lecturer (note that for openness and conscientiousness the relationship is negative, the more a student scored on these characteristics, the less they wanted a neurotic lecturer). Lecturer Extroversion The second variable we want to predict is lecturer extroversion. I won't run through the analysis and output, but you can find it in the file Charmorro You could report these results as follows: B SE B step 1 Constant Age .03 .12 .01 Gender .93 .94 .06 step 2 Constant Age .02 .12 .01 Gender .08 Neuroticism .00 .06 .01 Extroversion .15 .07 .14* Openness.
4 04 .07 .03 Agreeableness .00 .07 .00 Conscientiousness .10 .08 .10 Note. R2 = .00 for step 1; R2 = .03 for step 2 (ps > .05). *p < .05. PROFESSOR ANDY P FIELD 5 DISCOVERING STATISTICS USING spss So basically, student extroversion was the only significant predictor of wanting an extrovert lecturer; the model overall did not explain a significant amount of the variance in wanting an extroverted lecturer. Lecturer Openness to Experience The third variable we want to predict is lecturer openness to experience. As before, the spss output can be found in the file Charmorro You could report these results as follows: B SE B step 1 Constant Age .04 .12 .02 Gender .23 .92 .01 step 2 Constant Age .05 .12 .02 Gender .09 .96 .01 Neuroticism .01 .05 .01 Extroversion .07 .07 .05 Openness .26 .07 .20** Agreeableness .14 .06 .12* Conscientiousness .03 .07 .03 Note: R2 = .00 for step 1 (ns); R2 = .06 for step 2 (p < .001). * < .05, **p <.
5 001. So basically, student openness to experience was the most significant predictor of wanting a lecturer who is open to experience, but student agreeableness predicted this also. PROFESSOR ANDY P FIELD 6 DISCOVERING STATISTICS USING spss Lecturer Agreeableness The fourth variable we want to predict is lecturer agreeableness. As before, the spss output can be found in the file Charmorro You could report these results as follows: B SE B step 1 Constant Age .47 .14 .17 Gender .83 .04 step 2 Constant Age .47 .14 .17** Gender .78 .04 Neuroticism .14 .06 .13* Extroversion .05 .08 .03 Openness .22 .08 .14** Agreeableness .14 .07 .11 Conscientiousness .14 .09 .10 Note: R2 = .03 for step 1 (p < .01); R2 = .06 for step 2 (p < .001). *p < .05, **p < .01. Age, student openness to experience and student neuroticism significantly predicted wanting a lecturer who is agreeable. Age and openness to experience had negative relationships (the older and more open to experienced you are, the less you want an agreeable lecturer), whereas as student neuroticism increases so does the desire for an agreeable lecturer (not surprisingly, because neurotics will lack confidence and probably feel more able to ask an agreeable lecturer questions).
6 Lecturer Conscientiousness The final variable we want to predict is lecturer conscientiousness. As before, the spss output can be found in the file Charmorro You could report these results as follow: PROFESSOR ANDY P FIELD 7 DISCOVERING STATISTICS USING spss B SE B step 1 Constant Age .16 .11 .07 Gender .87 .14** step 2 Constant Age .14 .11 .06 Gender .91 .10 Neuroticism .01 .05 .01 Extroversion .06 .07 .05 Openness .01 .06 .01 Agreeableness .12 .06 .12* Conscientiousness .16 .07 .14* Note: R2 = .02 for step 1 (p < .05); R2 = .05 for step 2 (p < .01). *p < .05, **p < .01. Student agreeableness and conscientiousness both predicted wanting a lecturer who is conscientious. Note also that gender predicted this in the first step , but its b became slightly non significant (p = .07) when the student personality variables were forced in as well. However, gender is probably a variable that should be explored further within this context.
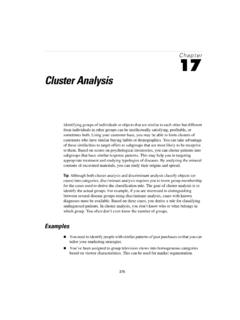
7 Compare your results to Table 4 in the actual article (shown below). I've highlighted the area of the table relating to our analyses (our five analyses are represented by the columns labelled N, E, O, A and C). PROFESSOR ANDY P FIELD 8 DISCOVERING STATISTICS USING spss Table 4 from Chamorro Premuzic et al. (2008) PROFESSOR ANDY P FIELD 9