Transcription of Land Values 2020 Summary 08/06/2020
1 United States Department of Agriculture National Agricultural Statistics Service ISSN: 1949-1867 Land Values 2020 Summary August 2020 Land Values 2020 Summary (August 2020) 3 USDA, National Agricultural Statistics Service Contents Agricultural Land Values Highlights .. 4 Average Farm real estate Value United States: 2006-2020 Chart .. 5 2020 Farm real estate Value by State Dollars per Acre and Percent Change from 2019 5 Average Cropland Value United States: 2006-2020 Chart .. 6 2020 Cropland Value by State Dollars per Acre and Percent Change from 2019 Map .. 6 Average Pasture Value United States: 2006-2020 Chart.
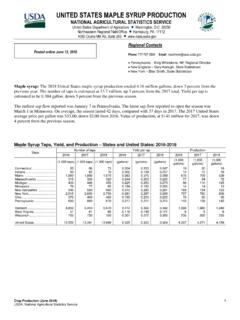
2 7 2020 Pasture Value by State Dollars per Acre and Percent Change from 2019 Map .. 7 Farm real estate Average Value per Acre Regions, States, and United States: 2016-2020 .. 8 Cropland Average Value per Acre Regions, States, and United States: 2016-2020 .. 10 Irrigated and Non-Irrigated Cropland Average Value per Acre States: 2016-2020 .. 12 Pasture Average Value per Acre Regions, States, and United States: 2016-2020 .. 14 Value of Farmland and Buildings States and United States: 16 Economic Regions .. 18 Statistical Methodology .. 19 Terms and Definitions .. 20 Information Contacts .. 21 4 Land Values 2020 Summary (August 2020) USDA, National Agricultural Statistics Service Agricultural Land Values Highlights The United States farm real estate value, a measurement of the value of all land and buildings on farms, averaged $3,160 per acre for 2020, no change from 2019.
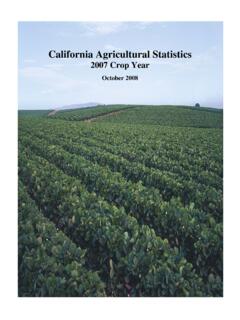
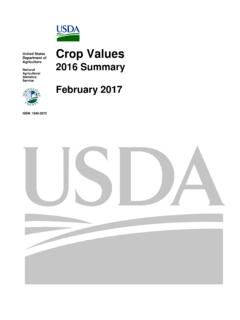
3 The United States cropland value averaged $4,100 per acre, no change from the previous year. The United States pasture value averaged $1,400 per acre, no change from 2019. Land Values 2020 Summary (August 2020) 5 USDA, National Agricultural Statistics Service 1,8302,0102,1702,0902,1502,3002,5202,730 2,9403,0002,9903,0303,1003,1603,16005001 ,0001,5002,0002,5003,0003,50020062007200 8200920102011201220132014201520162017201 820192020 Dollars per acreAverage Farm real estate Value United StatesUSDA -NASSA ugust 6, 2020 Average Farm real estate Value United States: 2006-2020 6 Land Values 2020 Summary (August 2020) USDA, National Agricultural Statistics Service 2,3002,5302,7602,6402,7002,9803,3503,810 4,0904,1004,0404,0304,0504,1004,10005001 ,0001,5002,0002,5003,0003,5004,0004,5002 0062007200820092010201120122013201420152 0162017201820192020 Dollars per acreAverage Cropland Value United StatesAverage Cropland Value United States.
4 2006-2020 USDA - NASS August 6, 2020 Land Values 2020 Summary (August 2020) 7 USDA, National Agricultural Statistics Service 9601,0301,0901,0601,0601,0701,1101,1701, 2901,3101,3201,3301,3701,4001,4000200400 6008001,0001,2001,4001,60020062007200820 0920102011201220132014201520162017201820 192020 Dollars per acreAverage Pasture Value United StatesUSDA -NASSA ugust 6, 2020 Average Pasture Value United States: 2006-2020 8 Land Values 2020 Summary (August 2020) USDA, National Agricultural Statistics Service Farm real estate Average Value per Acre Regions, States, and United States: 2016-2020 Region and State 2016 2017 2018 2019 2020 Change 2019-2020 (dollars) (dollars) (dollars) (dollars) (dollars) (percent) Northeast.
5 Connecticut .. Delaware .. Maine .. Maryland .. Massachusetts .. New Hampshire .. New Jersey .. New York .. Pennsylvania .. Rhode Island .. Vermont .. Lake States .. Michigan .. Minnesota .. Wisconsin .. Corn Belt .. Illinois .. Indiana .. Iowa .. Missouri .. Ohio .. Northern Plains .. Kansas .. Nebraska .. North Dakota .. South Dakota .. Appalachian .. Kentucky .. North Carolina .. Tennessee .. Virginia .. West Virginia .. 5,270 11,900 8,290 2,210 7,470 10,700 4,610 13,300 3,110 5,820 14,600 3,400 4,730 4,900 4,790 4,520 6,100 7,300 6,830 7,370 3,220 5,970 2,200 1,910 2,890 1,750 2,190 3,880 3,540 4,550 3,770 4,470 2,620 5,380 12,100 8,250 2,370 7,620 10,800 4,860 13,400 3,160 6,030 14,900 3,470 4,880 4,940 4,870 4,870 5,990 7,160 6,580 7,350 3,120 6,010 2,150 1,890 2,820 1,740 2,100 3,970 3,680 4,580 3,840 4,590 2,640 5,550 12,300 8,410 2,370 7,860 10,900 4,900 13,500 3,230 6,250 15,200 3,540 4,890 4,960 4,850 4,900 6,110 7,280 6,580 7,270 3,380 6,200 2,110 1,850 2,750 1,710 2,070 4,030 3,770 4,640 3,920 4,620 2,650 5,690 12,200 8.
6 950 2,410 8,060 11,100 4,980 13,500 3,250 6,470 15,600 3,630 4,900 4,960 4,840 4,950 6,100 7,280 6,580 7,190 3,400 6,290 2,170 1,960 2,850 1,740 2,070 4,080 3,820 4,680 3,990 4,650 2,680 5,710 12,000 8,950 2,490 8,080 11,300 5,000 13,600 3,150 6,600 16,000 3,550 4,860 4,950 4,840 4,850 6,110 7,400 6,600 7,070 3,400 6,350 2,120 1,900 2,790 1,720 2,010 4,140 3,920 4,670 4,100 4,620 2,700 - - - See footnote(s) at end of table. --continued Land Values 2020 Summary (August 2020) 9 USDA, National Agricultural Statistics Service Farm real estate Average Value per Acre Regions, States, and United States: 2016-2020 (continued) Region and State 2016 2017 2018 2019 2020 Change 2019-2020 (dollars) (dollars) (dollars) (dollars) (dollars) (percent) Southeast.
7 Alabama .. Florida .. Georgia .. South Carolina .. Delta States .. Arkansas .. Louisiana .. Mississippi .. Southern Plains .. Oklahoma .. Texas .. Mountain .. Arizona 1 .. Colorado .. Idaho .. Montana .. Nevada 1 .. New Mexico 1 .. Utah 1 .. Wyoming .. Pacific .. California .. Oregon .. Washington .. United States 2 .. 3,830 2,820 5,510 3,410 3,180 2,830 3,000 2,870 2,590 1,810 1,690 1,840 1,140 3,570 1,500 2,590 898 1,040 540 2,160 699 4,960 8,080 2,240 2,680 2,990 3,990 2,910 5,860 3,560 3,240 2,920 3,110 2,960 2,660 1,880 1,750 1,920 1,170 3,770 1,540 2,730 917 1,020 558 2,230 712 5,440 8,970 2,360 2,760 3,030 4,050 2,980 5,900 3,510 3,310 3,000 3,160 3,040 2,740 2,000 1,800 2,050 1,200 3,780 1,560 2,870 916 1,020 565 2,310 726 5,610 9,350 2,430 2,840 3,100 4,090 3,100 5,950 3,470 3,400 3,100 3,320 3,120 2,800 2,070 1,870 2,120 1,220 3,800 1,570 3,000 915 1,020 570 2,420 740 5,900 10,000 2,500 2,820 3,160 4,120 3,150 5.
8 900 3,500 3,500 3,130 3,350 3,160 2,820 2,110 1,890 2,170 1,240 3,850 1,590 3,110 915 1,000 575 2,450 750 5,910 10,000 2,530 2,760 3,160 - - - - Represents zero. 1 Excludes American Indian Reservation land. 2 Excludes Alaska and Hawaii. 10 Land Values 2020 Summary (August 2020) USDA, National Agricultural Statistics Service Cropland Average Value per Acre Regions, States, and United States: 2016-2020 Region and State 2016 2017 2018 2019 2020 Change 2019-2020 (dollars) (dollars) (dollars) (dollars) (dollars) (percent) Northeast .. Delaware .. Maryland .. New Jersey.
9 New York .. Pennsylvania .. Other States 1 .. Lake States .. Michigan .. Minnesota .. Wisconsin .. Corn Belt .. Illinois .. Indiana .. Iowa .. Missouri .. Ohio .. Northern Plains .. Kansas .. Nebraska .. North Dakota .. South Dakota .. Appalachian .. Kentucky .. North Carolina .. Tennessee .. Virginia .. West Virginia .. 5,650 8,090 6,910 13,500 2,690 6,450 7,290 4,750 4,590 4,840 4,660 6,500 7,350 6,690 7,510 3,570 6,070 2,900 2,080 4,750 1,910 3,430 3,980 3,980 4,060 3,670 4,610 3,220 5,700 7,960 7,050 13,600 2,740 6,470 7,630 4,840 4,580 4,920 4,870 6,380 7,210 6,300 7,440 3,560 6,150 2,760 2,010 4,430 1,890 3,200 4,070 4,140 4,090 3,730 4,730 3,250 5,940 8,120 7,280 13,700 2,800 6,890 7,650 4,810 4,510 4,950 4,740 6,370 7,280 6,210 7,290 3,490 6,320 2,740 2,060 4,380 1,870 3,120 4,140 4,250 4,130 3,830 4,760 3,250 6,040 8,600 7,370 13,700 2,810 7,030 7,900 4,760 4,500 4,810 4,850 6,360 7,300 6,210 7,260 3,490 6,400 2,790 2.
10 160 4,390 1,920 3,130 4,190 4,300 4,180 3,910 4,720 3,280 6,070 8,600 7,380 13,800 2,800 7,100 7,900 4,730 4,480 4,800 4,770 6,350 7,300 6,210 7,170 3,530 6,460 2,740 2,080 4,360 1,930 3,030 4,240 4,400 4,180 3,990 4,680 3,270 - - - - - See footnote(s) at end of table. --continued Land Values 2020 Summary (August 2020) 11 USDA, National Agricultural Statistics Service Cropland Average Value per Acre Regions, States, and United States: 2016-2020 (continued) Region and State 2016 2017 2018 2019 2020 Change 2019-2020 (dollars) (dollars) (dollars) (dollars) (dollars) (percent) Southeast.