Transcription of Lean Management Standards Gemba Worksheet
1 lean Management Standards Gemba Worksheet lean Management Gemba Worksheets No=0% Few<25% Some<50% Many>50% Most>75% All=100% 2014 DMLC Reprinted by Permission. From Creating a lean Culture, 3rd Edition Page 1 of 8 Visual Controls / Cycle Tracking Date: Location: Shift: Intent Visual controls should do at least one of two things: Reflect the actual vs. expected pace or progression of work (admin, support or line processes) Capture delays, interruptions, and frustrations that arise doing the work Diagnostic Questions 1. Can you see visual cycle or procedure tracking charts in the area? Do they show expected vs. actual times? 2. Are the charts current to this or last shift? 3. Are incidents that delay work described clearly (What we had but did not want, wanted but did not have)? 4. Are visuals reviewed regularly? How frequently? How can you tell? 5. Can leaders & task-level people in the area cite improvements from problems noted on visual charts? 6. Are visuals used here for support tasks, , materials, transport, attendance, assignments, qualifications?
2 7. Do leaders regularly review the visuals? How often? How can you tell? Assessment Rate this area/areas from 1 to 5 on the scale below and note the rationale for this rating 1: Pre- lean 2: Starting 3: Recognizable 4: Stabilizing 5: Sustainable No visuals / cycle tracking in place Some cycle tracking charts; irregularly filled in. Most charts record numbers, do not document delays, problems. Where problems described, too vague for action. No or irregular review for action on problems. Visuals more check the box than tool to highlight problems, delays and drive improvement. Many front line & support areas here use visuals / cycle tracking charts. Charts are current. Most descriptions of problems are complete, specific enough for next steps (cause analysis or corrective action). Charts reviewed daily or on regular schedule. Problems noted on charts often result in assignments for action. Visuals used for most line, support, & admin activities here. Visuals used at most handoffs between functions / departments w/ regular joint review for action.
3 Charts revised, added, dropped as things change. Nearly all problem descriptions clear, complete, actionable. Daily / regular reviews of charts drive assignments for cause analysis or corrective action. Visuals / cycle tracking charts regularly used throughout the area, front line, support, and administrative activities. Visuals / tracking charts initialed at least daily by line leaders and occasionally by executives. Visuals /cycle tracking charts regularly drive improvements, are also periodically analyzed to identify and act on recurring problems. Rationale for this rating: lean Management Standards Gemba Worksheet lean Management Gemba Worksheets No=0% Few<25% Some<50% Many>50% Most>75% All=100% 2014 DMLC Reprinted by Permission. From Creating a lean Culture, 3rd Edition Page 2 of 8 Standard Accountability Processes Date: Location: Shift: Intent Standard accountability processes: Accountability processes should convert problems/opportunities noted on visuals, the floor, or from suggestions to task assignments for cause analysis and/or corrective action in a daily Post-It (or equivalent) process for briefer tasks, a weekly A3 process for longer ones.
4 Diagnostic Questions 1. How are improvement assignments and projects managed here: visually, by spreadsheet or list, or not at all? 2. Are regular (daily or weekly) meetings held here to make new task assignments to address problems and follow up on overdue assignments? 3. Do the regular meetings here have clear purpose and agenda other than today s anticipated work? What is it? 4. Do visual controls/cycle tracking charts result in task assignments to address interruptions, delays, capacity losses? 5. How many area leaders are familiar with and able to apply basic project Management approaches like work breakdown structures and dependencies in thinking though and defining task assignments? 6. How well integrated are support, customer or supplier groups in this area s improvement activities? Assessment Rate this area/areas from 1 to 5 on the scale below and note the rationale for this rating 1: Pre- lean 2: Starting 3: Recognizable 4: Stabilizing 5: Sustainable No regularly occurring visual process to make or follow up on task assignments for improvement based on identified problems or delays.
5 Daily or weekly start up / team meetings held regularly for improvement task assignments; many are completed on time. Some assignments are to support or admin groups vs. line area, or are made in response to major problems. Some using green / red coding for on time completion or past due tasks. Team or area (line & support group) meetings regularly (daily/weekly) held to make, follow up on improvement task assignments. Tasks posted visible to all. Attendance is consistent; most tasks are completed, most on time, most leaders use green/red coding for on time or late task completion. Tasks respond to both major, minor incidents. Much reference to customer/ user/ patient perspective. Accountability meetings crisp, agenda followed, attendance faithful. Small assignments to visual accountability board; larger ones to A3 projects. Green/red coding is routine. Tasks from many sources, not just visuals but also employee suggestions, Gemba walks, support areas. Many in area use project Management skills on project work.
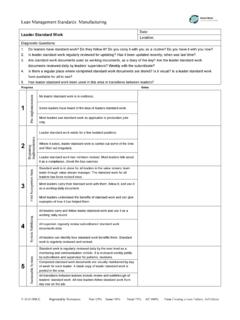
6 Customer perspective is a given. Using the accountability processes is routine in the area. All leaders regularly use basic project Management tools to determine task assignments, dependencies, durations. Support and admin representatives routinely participate in line accountability process and have their own. Customer s perspective informs most assignments, admin, support, frontline. Rationale for this rating: lean Management Standards Gemba Worksheet lean Management Gemba Worksheets No=0% Few<25% Some<50% Many>50% Most>75% All=100% 2014 DMLC Reprinted by Permission. From Creating a lean Culture, 3rd Edition Page 3 of 8 Leader Standard Work (LSW) Date: Location: Shift: Intent Leader standard work should reflect process focus: The closer to the task execution level, the more frequent the focus (admin., support processes, production/pt. care). Should reflect go to the place, talk with the people, look at the process for all levels of leadership. Review of visuals (current?)
7 Quality of entries? Regular in-shift review?), accountability (assignments linked to problems from visuals), follow up on improvement in leaders standard work (faithful execution of redefined processes. Diagnostic Questions 1. Do leaders in this area have standard work? Do they follow it? Do they routinely have it with them? Can leaders describe how standard work has helped them be more effective (if they see it that way)? 2. Are task level people in this area aware of the content of their leaders standard work? 3. Are leader standard work documents used as working diaries to record notes and observations? Do superiors meet with subordinate leaders to review these documents periodically? Ever? How often? 4. How often do this area s superiors review subordinate leaders standard work for updating based on new issues and changes, resulting from accountability board tasks? 5. Is there a defined place where completed standard work documents are stored for a few months? Is it used?
8 6. Has leader standard work been used in this area to facilitate transitions between leaders? 7. Is leader standard work focused on compliance or improvement or balanced? Assessment Rate this area/areas from 1 to 5 on the scale below and note the rationale for this rating 1: Pre- lean 2: Starting 3: Recognizable 4: Stabilizing 5: Sustainable No leader standard work (LSW) in place. Leader standard work exists for a few positions. It s rarely carried, is followed sporadically. The original content has not been revised, refined. Most leaders view it as a check the box activity to drive compliance with defined processes with little or no emphasis on improvement. Standard work exists for all line leaders in area: team, supervisor, manager. Most have their standard work with them, follow it, use it as working record of the day. Most leaders can give examples illustrating how leader standard work has helped them and sustained improvements. All leaders in the area carry, follow, and use their standard work as a daily working record.
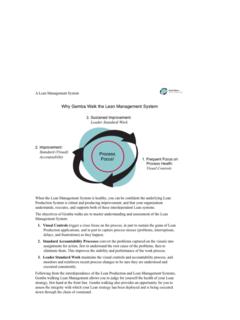
9 All superiors regularly review subordinate leaders LSW documents with them weekly. All leaders can talk about how LSW benefits them and the process. LSW is revised to reflect and sustain process changes. All transitions between leaders include review (possible revision), and walk through of LSW. All new leaders follow LSW from day one on job. Weekly LSW document review with superior used as monitoring, communication, and improvement method. Defined process for turn-in, storage LSW documents. Rationale for this rating: lean Management Standards Gemba Worksheet lean Management Gemba Worksheets No=0% Few<25% Some<50% Many>50% Most>75% All=100% 2014 DMLC Reprinted by Permission. From Creating a lean Culture, 3rd Edition Page 4 of 8 Value Stream Mapping Date: Location: Shift: Intent Value Stream Maps (VSMs) should do two things: Show the step-by-step movement of information, patients, and/or material through an area (or an entire value stream) that produces value for a customer, user, or patient internal or external.
10 Communicate process performance measures (safety, quality, time, cost), process problems, and improvement plans. Diagnostic Questions 1. Are value stream maps visible here? If so, do they show current and planned future states and measures? 2. Are improvements planned for the area (or complete value streams) visibly posted? Can people explain them? 3. Are VSMs used to identify, communicate, track, and measure process improvements in the area? 4. Do VSMs show planned kaizens, completion status of kaizens, and improvement targets in current vs. future state performance measures? Can people explain the maps, kaizens, and measures? 5. Who prepares value stream maps here? How many of this area s leaders are proficient value stream mappers? Assessment Rate this area/areas from 1 to 5 on the scale below and note the rationale for this rating 1: Pre- lean 2: Starting 3: Recognizable 4: Stabilizing 5: Sustainable No maps visible. Maps not used as part of area s improvement planning.