Transcription of Lebanon MIGRATION PROFILES - United Nations
1 Lebanon MIGRATION PROFILES . Part I. Global legal instruments related to international MIGRATION States parties to United Nations legal instruments Year ratified: Year ratified: - 1949 ILO MIGRATION for Employment Convention 1991 1989 Conv. on the Rights of the Child - 1951 Refugee Convention - 1990 UN Migrant Workers Convention - 1967 Refugee Protocol 2005 2000 Human Trafficking Protocol - 1975 ILO Migrant Workers Convention 2005 2000 Migrant Smuggling Protocol Part II. Population indicators Population estimates 1990 2000 2010 2013 30. Males ('000) 1 333 1 605 2 213 2 450. Females ('000) 1 370 1 630 2 128 2 372 20. Total ('000) 2 703 3 235 4 341 4 822 10. Percentage urban population 83 86 87 87. Percentage rural population 17 14 13 13 0. -10. 1985-90 1995-00 2005-10 2010-15. -20. Average annual rate of change Annual rate of natural increase* 1985-90 1995-00 2005-10 2010-15. Crude net MIGRATION rate* Annual rate of natural increase*. Total net MIGRATION ('000) -228 -29 183 500.
2 * Per 1,000 population Crude net MIGRATION rate*. Projected change in total population by component (x 1000) 15. 10. 2015-20 2025-30 2035-40 2045-50. 5. Total population at end of period 4 877 5 172 5 304 5 316. Population change during period -176 129 47 -7 0. Annual rate of natural increase* -5. Crude net MIGRATION rate* -10. * Per 1,000 population -15. Projected change in working-age (15-64) population (x 1000) -20. 2015-20 2025-30 2035-40 2045-50. 2015-20 2025-30 2035-40 2045-50. Medium variant -192 11 -3 -173 Annual rate of natural increase*. Zero- MIGRATION variant 156 12 32 -117 Crude net MIGRATION rate*. Difference -347 0 -35 -56. Part III. Development indicators Development indicators (years are approximate for some indicators / countries). 1990 2000 2010 2013* 82. Life expectancy at birth 80. Adult literacy rate (ages 15 and older) .. 78. Combined gross enrolment ratio in 76. Years education (per cent) 74. HDI. GDP per capita (PPP in thousands of US 72. dollars) 4 519 8 853 13 639 14 610 70.
3 Human development index (HDI) .. 68. * 2013 or latest available 66. 64. Remittances (years are approximate for some indicators / countries) 1990 2000 2010 2013*. 1990 2000 2010 2012*. Inflows (millions of US dollars) .. 7653 7472 Human development index (HDI). Outflows (millions of US dollars) .. 4749 4820 Life expectancy at birth Inflows as a share of GDP (%) .. * Estimate Lebanon Part IV. International migrant stocks International migrant stock by age and sex 1990 2000 2013. Male Female Total Male Female Total Male Female Total 0-4 14 098 21 884 35 982 18 105 27 349 45 454 30 738 33 960 64 698. 5-9 12 927 18 932 31 859 16 584 23 662 40 246 25 244 29 541 54 785. 10-14 13 014 17 655 30 669 18 185 24 069 42 254 24 117 27 402 51 519. 15-19 17 899 19 295 37 194 20 758 21 912 42 670 28 490 29 227 57 717. 20-24 33 328 27 403 60 731 31 042 25 085 56 127 34 930 32 034 66 964. 25-29 49 443 35 610 85 053 45 047 31 931 76 978 42 200 35 892 78 092. 30-34 44 985 34 057 79 042 51 345 38 239 89 584 48 086 38 649 86 735.
4 35-39 32 697 27 763 60 460 50 420 42 060 92 480 49 986 38 429 88 415. 40-44 20 042 18 661 38 703 39 212 35 824 75 036 47 861 36 917 84 778. 45-49 11 728 11 649 23 377 26 823 26 120 52 943 40 102 32 547 72 649. 50-54 7 046 7 534 14 580 16 351 17 127 33 478 30 730 27 064 57 794. 55-59 4 507 5 391 9 898 9 690 11 335 21 025 21 130 20 716 41 846. 60-64 3 332 4 812 8 144 6 032 8 492 14 524 14 261 13 834 28 095. 65+ 2 876 5 125 8 001 3 711 6 403 10 114 7 202 8 432 15 634. Total 267 922 255 771 523 693 353 305 339 608 692 913 445 077 404 644 849 721. Total population by age and sex, 2013 Migrant stock by age and sex, 2013. 65+ Native-born Foreign-born (males) Native-born (males) Foreign-born (females) (females) 65+. Males Females 60-64 0-4 60-64 55-59. 50-54 5-9 55-59 45-49 50-54. 40-44 10-14 45-49 35-39 15-19 40-44 30-34 35-39. 25-29 20-24 30-34 20-24 25-29 25-29 15-19 20-24. 10-14 30-34 15-19. 5-9 35-39 10-14 0-4 5-9. 40-44 6 4 0 2 4 6 0-4. 45-49 50-54 6 4 2. Percentage 2 4 6.
5 55-59 Native-born (males). (males) Males Females Native-born (females) Foreign-born (females). 60-64 65+ Migrant stock by origin (2013) Migrant stock by destination (2013). Top 5 countries or areas of origin Total Top 5 countries or areas of destination Total State of Palestine 549 341 United States of America 126 355. Iraq 148 470 Australia 96 800. Egypt 102 507 Canada 87 536. Syrian Arab Republic 21 411 Germany 67 031. Sri Lanka 4 025 Saudi Arabia 57 098. Total 825 754 Total 434 820. Refugee population by origin (end 2012) Refugee population by destination (end 2012). Top 5 countries or areas of origin Total Top 5 countries or areas of destination Total State of Palestine 474 053 Germany 11 819. Syrian Arab Republic 126 939 0. Iraq 6 516 0. 0 0. 0 0. Total 607 508 Total 11 819. Tertiary students by origin (2013) Tertiary students by destination (2013). Top 5 countries or areas of origin Total Top 5 countries or areas of destination Total 0 France 4 813. 0 United States of America 1 434.
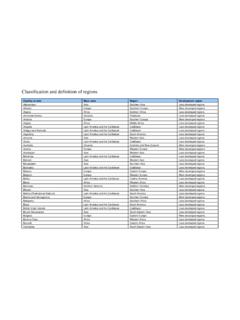
6 0 United Arab Emirates 1 092. 0 Italy 778. 0 Germany 632. Total Total 8 749. DEFINITIONS AND SOURCES. States parties to United Nations legal instruments : Indicates whether a country has ratified the relevant international instrument and if so, the year of ratification. The relevant instruments are the 1951 Convention relating to the Status of Refugees; the 1967 Protocol relating to the Status of Refugees, and the 1990 International Convention on the Protection of the Rights of All Migrant Workers and Members of their Families. In addition, two Protocols relevant to international MIGRATION supplement the United Nations Convention against Transnational Organized Crime, namely the 2000 Protocol to Prevent, Suppress and Punish Trafficking in Persons, Especially Women and Children and the 2000 Protocol against the Smuggling of Migrants by Land, Sea and Air. Source : United Nations Treaty Collection. See: Males: De facto male population as of 1 July of the year indicated. Data are presented in thousands.
7 Source: United Nations , Department of Economic and Social Affairs, Population Division (2013). World Population Prospects: The 2012 Revision. Females: De facto female population as of 1 July of the year indicated. Data are presented in thousands. Source: United Nations , Department of Economic and Social Affairs, Population Division (2013). World Population Prospects: The 2012 Revision. Total population: De facto population in a country, area or region as of 1 July of the year indicated. Figures are presented in thousands. Source: United Nations , Department of Economic and Social Affairs, Population Division (2013). World Population Prospects: The 2012 Revision. Percentage urban population: Urban population as a percentage of the total population. Source: United Nations , Department of Economic and Social Affairs, Population Division (2012). World Urbanization Prospects: The 2011 Revision. Percentage rural population: Rural population as a percentage of the total population.
8 Source: United Nations , Department of Economic and Social Affairs, Population Division (2012). World Urbanization Prospects: The 2011 Revision. Annual rate of change: Average exponential rate of growth of the population over a given period. It is expressed as a percentage. Source: United Nations , Department of Economic and Social Affairs, Population Division (2013). World Population Prospects: The 2012 Revision. Annual rate of natural increase: Crude birth rate minus the crude death rate. Represents the portion of population growth (or decline) determined exclusively by births and deaths. Source: United Nations , Department of Economic and Social Affairs, Population Division (2013). World Population Prospects: The 2012. Revision. Crude net MIGRATION rate: The ratio of net MIGRATION during the year to the average population in that year. The value is expressed per 1 000 inhabitants. Source: United Nations , Department of Economic and Social Affairs, Population Division (2013).
9 World Population Prospects: The 2012 Revision. Total net MIGRATION : Net number of migrants, that is, the number of immigrants minus the number of emigrants. It is expressed in thousands. Source: United Nations , Department of Economic and Social Affairs, Population Division (2013) World Population Prospects: The 2012 Revision. Total population at end of period: Total population on 30 June of the final year of the period. Data are from the medium variant (see below) of the World Population Prospects. Source: United Nations , Department of Economic and Social Affairs, Population Division (2013). World Population Prospects: The 2012 Revision. Population change during period: Total population change over a period, that is, the difference between the population at the end of the period and that at the beginning of the period. Source: United Nations , Department of Economic and Social Affairs, Population Division (2013). World Population Prospects: The 2012. Revision. Medium variant: The medium projection variant combines the medium fertility assumption together with normal-mortality and normal international MIGRATION assumptions and is a central reference for trends over the longer term that results from the probabilistic approach that simulates future fertility paths for each country.
10 Source: United Nations , Department of Economic and Social Affairs, Population Division (2013). World Population Prospects: The 2012 Revision. Zero- MIGRATION variant: Under this assumption, the medium variant is modified so that international MIGRATION for each country is set to zero starting in 2010-2015. Source: United Nations , Department of Economic and Social Affairs, Population Division (2013). World Population Prospects: The 2012 Revision. Life expectancy at birth: Number of years a newborn infant could expect to live if prevailing patterns of age-specific mortality rates at the time of birth stay the same throughout the infant's life. Source: United Nations , Department of Economic and Social Affairs, Population Division (2013). World Population Prospects: The 2012 Revision. Adult literacy rate: The percentage of population aged 15 years and older who can both read and write with understanding a short simple statement on his/her everyday life. Generally, literacy' also encompasses numeracy', the ability to make simple arithmetic calculations.