Transcription of Lecture 2 Linear Regression: A Model for the Mean
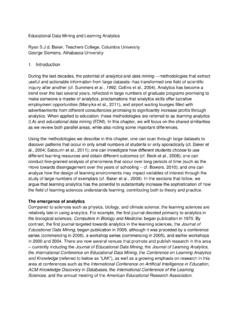
1 Lecture 2 Linear Regression: A Model for the MeanSharyn O HalloranSpring 20052U9611 Closer Look at: Linear regression Model Least squares procedure Inferential tools Confidence and Prediction Intervals Assumptions Robustness Model checking Log transformation (of Y, X, or both)Spring 20053U9611 Linear regression : Introduction Data: (Yi, Xi) for i = 1,..,n Interest is in the probability distribution of Y as a function of X Linear regression Model : Mean of Y is a straight line function of X, plus an error term or residual Goal is to find the best fit line that minimizes the sum of the error termsSpring valuesPHEstimated regression lineSteer example (see Display , p.)
2 177).73 Intercept= for estimated regression line:Equation for estimated regression line:^Fitted lineError termSpring 20055U9611 Create a new variableltime=log(time) regression analysisSpring 20056U9611 regression TerminologyRegressionRegression: the mean of a response variable as a function of one or more explanatory variables: {Y | X} regression modelRegression Model : an ideal formula to approximate the regressionSimple Linear regression modelSimple Linear regression Model :XXY10}|{ +=InterceptSlope mean of Y given X or regression of Y on X UnknownparameterSpring 20057U9611Y s probability distribution is to be explained by Xb0and b1are the regression coefficientsregression coefficients(See Display , p.
3 180)Note: Y = b0+ b1X is NOT simple regressionControl variableResponse variableExplanatory variableExplained variableIndependent variableIndependent variableDependent variableDependent variableXXYYR egression TerminologySpring 20058U9611 regression Terminology: Estimated coefficients101010 XX++10 +10 +X10 +X10 +Choose and to make the residuals small0 1 Spring 20059U9611 Fitted valueFitted valuefor obs. i is its estimated mean: ResidualResidualfor obs. i: Least SquaresLeast Squaresstatistical estimation method finds those estimates that minimize the sum of squared (from calculus) on p.
4 182 of SleuthXXYfitYi10}|{ +=== regression TerminologyYYeii fit - Y resiii = = == =+ niiniiiyyxy121210) ())(( Spring 200510U9611 Least Squares Procedure The Least-squares procedure obtains estimates of the Linear equation coefficients 0and 1, in the Model by minimizing the sum of the squared residualsor errors (ei) This results in a procedure stated as Choose 0and 1so that the quantity is minimized. iixy10 +=22) (iiiyyeSSE == 2102))((iiixyeSSE + == Spring 200511U9611 Least Squares Procedure The slope coefficient estimator is And the constant or intercept indicator isXYxyniiniiissrXxYyXx= = ==1211)())(( XY10 =CORRELATION BETWEEN X AND YSTANDARD DEVIATION OF Y OVER THE STANDARD DEVIATION OF XSpring 200512U9611 Least Squares Procedure(cont.)
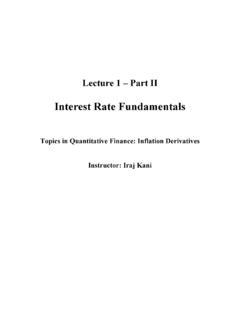
5 Note that the regression line always goes through the mean X, Between Yield and Fertilizer020406080100010020030040050060 0700800 Fertilizer (lb/Acre)Yield (Bushel/Acre)Trend lineThat is, for any value of the independent variable there is a single most likely value for the dependent variable Think of this regression line as the expected value of Y for a given value of X. Spring 200513U9611 Tests and Confidence Intervals for 0, 1 Degrees of freedom: (n-2) = sample size - number of coefficients Variance{Y|X} 22= (sum of squared residuals)/(n-2) Standard errors(p. 184) Ideal normal Model : the sampling distributions of 0 and 1 have the shape of a t-distribution on (n-2) Do t-tests and CIs as usual (df=n-2)Spring 200514U9611 Confidence intervalsP values for Ho=0 Spring 200515U9611 Inference Tools Hypothesis TestHypothesis Testand Confidence IntervalConfidence Intervalfor mean of Y at some X.
6 Estimate the mean of Y at X = X0by Standard Error of Conduct t-test and confidence interval in the usual way (df = n-2)0100 }|{ XXY +=2200)1()(1 }]|{ [xsnXXnXYSE += 0 Spring 200516U9611 Confidence bands for conditional meansthe lfitcilfitcicommand automatically calculate and graph the confidence bandsconfidence bands in simple regression have an hourglass shape, narrowest at the mean of XSpring 200517U9611 Prediction PredictionPredictionof a future Yat X=X0 Pred Standard error of predictionStandard error of prediction:}|{ )|(00 XYXY =Variability of Y about its meanUncertainty in the estimated mean 95% prediction interval95% prediction interval:)]|(Pred[*)975(.
7 |(Pred00 XYSEtXYdf 2020)])|( [( )]|(Pred[XYSEXYSE +=Spring 200518U9611 Residuals vs. predictedvalues plotAfter any regression analysis we can automatically draw a residual-versus-fitted plot just by typingSpring 200519U9611 Predicted values (yhatyhat)After any regression ,the predictpredictcommand can create a new variable yhatyhatcontaining predicted Y valuesabout its meanSpring 200520U9611 Residuals (ee)the residresidcommand can create a new variable eecontaining the residualsSpring 200521U9611 The residual-versus-predicted-values plot could be drawn by hand using these commandsSecond type of confidence interval for regression prediction.)
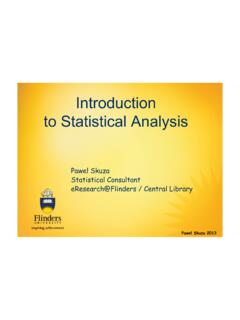
8 Prediction bandprediction band This express our uncertainty in estimating the unknown value of Y for an individual observation with known X valueCommand:lftcilftciwith stdfstdfoptionAdditional note: Predict: Predictcan generate two kinds of standard errorsstandard errorsfor the predicted y value, which have two different applications. 0123 Distance-5 00050 01000 VELOCITYC onfidence bands for conditional means (stdp)-10123 Distance-50005001000 VELOCITYC onfidence bands for individual-case predictions (stdf)Spring 200524U96110123 Distance-5 00050 01000 VELOCITYC onfidence bands for conditional means (stdp)-10123 Distance-50005001000 VELOCITYC onfidence bands for individual-case predictions (stdf)95% confidence interval95% confidence intervalfor {Y|1000}95% prediction interval95% prediction intervalfor Y at X=1000confidence bandconfidence band: a set of confidence intervalsfor {Y|X0}Calibration intervalCalibration interval.
9 Values of Xfor which Y0is in a prediction intervalSpring 200525U9611 Notes about confidence and prediction bands Both are narrowest at the mean of X Beware of extrapolation The width of the Confidence Interval is zero if n is large enough; this is not true of the Prediction this is not true of the Prediction 200526U9611 Review of simple Linear regression220211210101211210)1/()/1(/ ) ()1(/ ) ()2/( ),..,1( .)(/))(( }|var{}|{2xxniiiiiniiniiisnXnSEsnSEnresn iXYresXYXXYYXXXYXXY += = == = = ==+= === 1. Model with constant squaresLeast squares: choose estimators 0and 1to minimize the sum of squared PropertiesPropertiesof 200527U9611 Assumptions of Linear regression A Linear regression Model assumes: Linearity: {Y|X} = 0+ 1X Constant Variance: var{Y|X} = 2 Normality Dist.
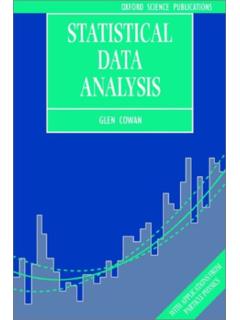
10 Of Y s at any X is normal Independence Given Xi s, the Yi s are independentSpring 200528U9611 Examples of Violations Non-Linearity The true relation between the independent and dependent variables may not be Linear . For example, consider campaign fundraising and the probability of winning an election. $50,000 P(w) Spending Probability of Winning an ElectionThe probability of winning increases with each additional dollar spent and then levels off after $50, 200529U9611 Consequences of violation of linearity If linearity is violated, misleading conclusions may occur (however, the degree of the problem depends on the degree of non-linearity):Spring 200530U9611 Examples of Violations: Constant Variance Constant Variance or Homoskedasticity The Homoskedasticity assumption implies that, on average, we do not expectto get larger errors in some cases than in others.