Transcription of Lesson 11: Rational Method Step 5: Calculating Time of ...
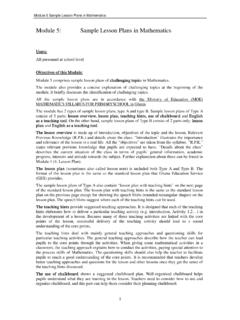
1 Lesson 11: Rational MethodStep 5: Calculating time of ConcentrationThe travel time for a portion of the hydraulic path is the length of time it would take a drop of water to flow across that area of land. The time of concentration equals the summation of the travel times for each flow regime along the hydraulic path. There are numerous methods used to calculate the travel time for each of the flow regimes. Here, we will discuss the most prevalent methods . These methods use charts called nomographs so that you will not have to make complicated mathematical calculations, but you should be aware that the accuracy of your calculation will depend on your careful use of the Flow - LoTravel time for overland flow can be determined by using the Seelye chart. This Method is perhaps the simplest and is most commonly used for small developments where a greater margin of error is acceptable. If the ground cover conditions are not homogeneous for the entire overland flow path, determine the travel time for each ground cover condition separately and add the travel times to get overland flow travel time .
2 Do not use an average ground cover condition. To use the Seelye Chart, first determine the length of overland flow and enter the nomograph on the left axis ("Length in Feet") at the appropriate point. In our example, the length of overland flow is 1,000 feet, so we begin at 1,000 on the axis on the far left side of the Seelye Chart. We draw a line from this point to intersect the appropriate "Coefficient of Imperviousness", which is dense grass in the case of our example. We extend the line from the "Length in Feet" axis through the "Coefficient of Imperviousness" axis and to the "Pivot Line", as shown by the red line 1 of 7 Lesson 8: Estimating Runoff11/18/2013 the "Pivot Line", our line can change direction. From this point, we intersect the appropriate "Percentage Slope", which is 10% in the case of our example. Extending this line, we intersect the "Inlet time of Concentration in Minutes" axis at a point which will show the travel time for overland flow. In the case of our example, the travel time is minutes.
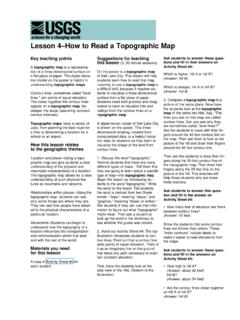
3 Shallow Concentrated Flow - LscNow that we know the travel time for the overland flow, we need to calculate the travel time for the shallow concentrated flow along the hydraulic path. The first step is determine the velocity of the flow using Diagram 1. You will need to know the slope of the shallow concentrated flow and whether the flow path is paved or 2 of 7 Lesson 8: Estimating Runoff11/18/2013 our example, the shallow concentrated flow has a slope of and the path is unpaved. So we enter Diagram 1 at a slope of on the vertical axis ("Watercourse slope") and draw a line horizontally until we intersect the "Unpaved" line on the diagram. From this point, we draw a line vertically down to intersect the "Average velocity" axis. The average velocity in our example is feet per second. Now we can calculate the travel time using the following equation:Where: Tt = travel time L = length of shallow concentrated flow in feet V = velocity (in feet per second, from Diagram 1) In our example the length of the shallow concentrated flow is 600 feet.
4 The travel time would be calculated as follows:So, the travel time for the shallow concentrated flow portion of the hydraulic path is minutes. Page 3 of 7 Lesson 8: Estimating Runoff11/18/2013 Flow - LcThe last flow regime we need to consider is channel flow. To calculate channel flow, we need to know: Length of channel flow in feet Height above the outlet of the most remote point in the channel Whether the channel is pavedYou can use one of two methods to find the height of the most remove point above the outlet. If the channel is accurately drawn onto a topo map, then you can count the number of contour lines crossed by the channel and calculate the elevation change accordingly. (For example, if there is a contour interval of 40 and your channel spans three contour intervals, then the change in elevation is 120 feet.) Alternatively, if you know the length of the channel and the slope, you can simply multiply the length by the slope (in feet/foot). For example, a 500 foot long channel with a slope of has a change in elevation of:500 feet = 120 feetThen we simply use this data with the Kirpitch Chartto determine the travel time .
5 There is no channel flow in our example for this Lesson . However, we will consider a channel flow with a height above outlet of 120 feet and a length of 500 feet to show you how to use the Kirpitch Chart. Page 4 of 7 Lesson 8: Estimating Runoff11/18/2013 you can see from the chart above, if our channel was unpaved, the travel time would be minutes. Since our hypothetical channel is paved, we have to multiply this time by So the time of travel in our paved channel is minutes. Total time of ConcentrationThe time of concentration along our sample hydraulic path is simply the sum of the travel times for the overland flow, shallow concentrated flow, and channel flow. Tc = Lo + Lsc + LcIn our example, the time of concentration is calculated as follows:Tc = + + 0Tc = , the time of concentration for our watershed is 5 of 7 Lesson 8: Estimating Runoff11/18/2013 6: IntensityFinding the intensity based on the calculated time of concentration requires us to use an I-D-F curve which specifies the rainfall intensity for a certain region.
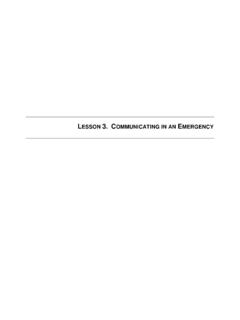
6 Appendix 4D of your text includes I-D-F curves for many counties in Virginia. If your county is not present, you can use the I-D-F curve of a neighboring county. Each I-D-F chart includes several different curves, each of which corresponds to a different type of storm. In this Lesson , we will consider the 2 year storm curves, which model the rainfall in the largest storm which typically occurs in the region once every two years. In a later Lesson , I will ask you to use the 10 year storm curves. The chart also contains a curve for the 5 year storm, the 25 year storm, the 50 year storm, and the 100 year storm. When working with these curves, keep in mind that these are statistical models --- a 100 year storm is statistically likely to happen once every 100 years, but might happen twice in a decade or never during a century. In our case, we will be using the 2-year storm data for Wise County. On the correct chart, we find a duration of minutes on the horizontal axis.
7 Then we draw a vertical line from this point until it reaches the correct I-D-F curve --- the one labelled as a 2-year storm curve. From this point, we draw a line horizontally until it reaches the vertical axis. This point is the rainfall intensity. Using the time of concentration of minutes and the 2-year storm model for Wise County, we have an intensity of inches per 6 of 7 Lesson 8: Estimating Runoff11/18/2013 7: Estimating Peak RunoffNow we have all of the information we need to estimate peak runoff in our watershed using the Rational Method . The Rational formula is: Q = C i AWhere: Q = Peak rate of runoff in cubic feet per secondC = Runoff coefficient, an empirical coefficient representing a relationship between rainfall and runoff i = Average intensity of rainfall for the time of concentration (Tc) for a selected design storm A = Drainage area in acresSince our watershed is a relatively steep pasture with heavy soil, the C value is The drainage area was calculated as acres, and the intensity has just been shown to be inches per hour.
8 So the peak runoff is:Q = ( ) ( ) ( )Q = peak runoff during a 2-year storm in our watershed would be cubic feet per second. Part 4: One More ExamplePage 7 of 7 Lesson 8: Estimating Runoff11/18/2013