Transcription of Leveraging Big Data for Supply Chain Benchmarking
1 Leveraging Big data for Supply Chain Benchmarking JDA FocusConnect | November 5, 2013 Agenda Who is Chainalytics? Freight Market Intelligence Consortium Sales & Operations Variability Consortium Questions 2 Agenda Who is Chainalytics? Freight Market Intelligence Consortium Sales & Operations Variability Consortium Questions 3 Who is Chainalytics? MILESTONES Founded in 2001 Established Bangalore office in 2005 Acquired Chainnovations and Adalis Packaging Solutions Group in 2011 Strategic Investment by GEF Acquired ROCE Partners in 2013 ACCOLADES 2013 Cool Vendor in Supply Chain Services gartner Great Supply Chain Partner for 10 Years SupplyChainBrain 8 Pros to Know Supply & Demand Chain Executive One of 10 Coolest Supply Chain Boutiques ARC Advisory BY THE NUMBERS 135 FTEs Worldwide Serve 300+ Unique Clients 17 of gartner s Top 25 Supply Chains 80 Fortune 500 Companies Delivered 500+ Engagements ATLANTA MINNEAPOLIS MILAN STOCKHOLM HELSINKI BANGALORE 4 Years Quarters Months Weeks Planning Horizon Value-Driven Supply Chain Decisions At what service level can we profitably satisfy demand?
2 How should we transport product through the Supply Chain ? How much and where should inventory be positioned in the Supply Chain ? Can we reduce our transport and logistics costs by improving cube utilization? Should our warehousing and material operations be insourced or outsourced? When should we buy or make product to make the best use of our capacity? What is the best flowpath? How well do our current operations mitigate repair and warranty costs? How can we increase visibility to stakeholders? Sales & Operations Planning Transportation Logistics Operations Service Supply Chain Packaging Optimization Supply Chain Design 5 Some of Our Clients LSP Chemical/Process Automotive & Industrial Packaging Healthcare HIGH TECH & TELECOM FOOD & BEVERAGE RETAIL HOME/OFFICE DURABLES HOME/OFFICE NON-DURABLES OTHER INDUSTRIES SERVED 6 Widespread implementation of ERP and Supply Chain Planning Hardware commoditization enabled big data era Analytics converts big data into small data Content enables fact-based decision-making Evolution of the Big data Opportunity Content makes the realization of the full value of big data possible.
3 Chainalytics empowers fact-based decisions Powerful Technology: Advanced tools to assess impacts and predict outcomes Specialized Knowledge: Superior intellectual capital to bridge the Supply Chain expertise gap Proprietary Content: Competitive differentiation Content Knowledge Technology 7 Agenda Who is Chainalytics? Freight Market Intelligence Consortium Sales & Operations Variability Consortium Questions 8 Model-Based Benchmarking Advantage Traditional Benchmarking Model-Based Benchmarking Shipper s freight characteristics are unique Lack of apples to apples comparison Need to have significant volumes represented across many shippers for exact lane by lane match Proprietary rates restrict direct sharing Inability to share rate information due to contractual obligations Informal peer network not a good basis for comparison Only total cost is provided Inability to separate line haul and accessorial costs Inability to determine implied cost of business practices that impact operation Identify/quantify transportation cost drivers Origin, destination, distance, loading conditions, service requirements.
4 Regional Build econometric model for the market Includes broad cross-section of shippers & locations Ensure it is robust and statistically valid Develop an reliable estimators to predict the cost per load for TL freight, given unique characteristics of the freight Generate results consistent with our experience Actual and observed results are related Test all policies and characteristics for statistical strength Amass significant amounts of information Corridor volume 9 Consortium What is a Freight Market Intelligence Consortium ? Freight Market guidelines No input data shared Membership remains confidential Intelligence MARKET INTELLIGENCE External Focus BUSINESS INTELLIGENCE Internal Focus data MODELS REPORTS 10 FMIC Overview 11 2004 TL Model for 6 Shippers TODAY TL & IM Models: 108 Shippers ($ ) LTL Model: 23 Shippers ($482MM) Ocean: 16 Shippers ($290MM) What is my overall cost position to the market?
5 In which lanes am I over market? (ALL MODES) Performance Reports Rate Estimators What are estimated costs for lanes in which I am not operating today? Where are some opportunities to convert from collect to prepaid freight? (TL & LTL) Members Gain Access Freight Market Intelligence In what direction will rates trend in the future (according to the views of the members)? What does my carrier profile look like? How do my policies and practices affect my rates? (ALL MODES) Lane Specific Analysis FirmBUFMIC IDOrigin CityOrigin StateOrigin ZIPO rigin CountryDestinationCityDestStateDestZIPDe stCountry Distance (miles) Annual Anystate18953 HUNA nytown Anystate08123 GER2922643 DEMOWWD211142 Anytown Anystate50995 FRAA nytown Anystate21999 GER24141340 DEMOWWD113682 Anytown Anystate18394 GERA nytown Anystate68960 POL27711570 DEMOWWD214131 Anytown Anystate35199 POLA nytown Anystate77899 HUN5463521 DEMOWWD211452 Anytown Anystate29979 HUNA nytown Anystate27716 POR2919230 DEMOWWD113132 Anytown Anystate13752 POLA nytown Anystate58260 GER2921191 DEMOWWD113467 Anytown Anystate13149 FRAA nytown Anystate64882 GER2914681 DEMOWWD110702 Anytown Anystate17090 ITAA nytown Anystate13249 GER2886201 DEMOWWD310541 Anytown Anystate73508 GERA nytown Anystate10568 POL2440990 DEMOWWD210041 Anytown Anystate47489 HUNA nytown Anystate00807 FRA2791700 DEMOWWD214132 Anytown Anystate52411 ITAA nytown Anystate77914 FRA2738692 DEMOWWD314098 Anytown
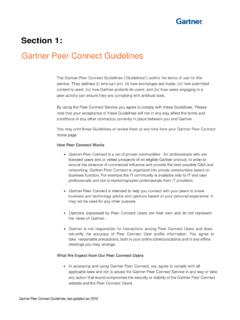
6 Anystate60540 GERA nytown Anystate77223 POR2796670 DEMOWWD212340 Anytown Anystate27880 ITAA nytown Anystate43424 POR2912142 DEMOWWD212503 Anytown Anystate45769 ITAA nytown Anystate46709 ITA4712360 Estimated CPL (Including Fuel Surcharge) Estimated CPM (Including Fuel Surcharge) Estimated Annual Cost (Including Fuel Surcharge) Difference CPL (Including Fuel Surcharge) Annual Cost Difference (Including Fuel Surcharge) Difference Percent (Including Fuel Surcharge) Status (Including Fuel Surcharge) EUR 4, 273, (EUR 2,821)(EUR 180,513) 4, 577, (EUR 581)(EUR 77,873) 4, 641, (EUR 495)(EUR 77,683) 1, 506, (EUR 199)(EUR 70,205) 4, 98, (EUR 2,835)(EUR 65,203) 4, 81, (EUR 2,947)(EUR 56,001) 4, 306, (EUR 812)(EUR 55,193) 4, 84, (EUR 2,643)(EUR 52,863) 3, 377, (EUR 529)(EUR 52,393) 5, 369, (EUR 684)(EUR 47,885) 4, 309, (EUR 684)(EUR 47,180) 4, 333, (EUR 610)(EUR 40,871) 4, 59, (EUR 2,858)(EUR 40,016) 227, (EUR 161)(EUR 37,894) Long Haul Dry Van Comparison to Industry 13 Company B Company A Carriers by Spend and Position to Market Each square represents a carrier in a shipper s network Size is relative to volume with that carrier Color and percentage represent the carrier s relative cost to market across all lanes they service The FMIC allows shippers to see how their carriers are performing across their total spend, which prompts such questions such as Who should I grow with?
7 And Who should I look to divest? 14 Industry Benchmark Lane Information JDA has partnered with Chainalytics to provide access to the largest transportation Benchmarking database in North America directly within its TMS solution. Integrated Benchmark Rates Industry Leading TMS Solution Freight Market Intelligence Consortium 15 Integrated Benchmark Rates Carrier or Load Comparison 16 FMIC Europe Milestones Charter Member Identification Promote to current multi-national FMIC members Prepare data collection materials Completion November 2013 1 Product Design & Development Completion 2013 Q4 2 Define Europe specific deliverables with charter members Completion 2014Q1+2 Modeling, Analytics & Reporting 3 Development of econometric and reporting constructs Modification of existing capabilities defined specifically for Europe Charter Member Feedback & Adoption Completion 2014 Q2 4 Obtaining feedback Adapting process.
8 Reports and survey insights for future rounds Determination of ongoing service parameters We will analyze 12 months of data (6 months apart), and produce two sets of deliverables each year. 17 Agenda Who is Chainalytics? Freight Market Intelligence Consortium Sales & Operations Variability Consortium Questions 18 Demand Planning Market Intelligence Questionnaire-based Participants self-report forecast accuracy as they measure it Forecasting process checklist Attempt to define best practices Limited root-cause and comparative analysis Model-based using transaction data Common metrics Insights into drivers Supplemental questionnaire Business practices driving forecast accuracy (FCA) Demand and Supply planning practices Conventional Benchmarks Sales & Operations Variability Consortium SOVC Member Demographics Industry: Non-Durable Consumer Product Goods and Food & Beverage Geography: Customer Demand Members: 40+ Participants Item-Locations.
9 More than 300,000 FOOD & BEVERAGE 49% PERSONAL CARE 33% HOME CARE 13% PET CARE 5% 19 How does Chainalytics SOVC work? Model-Based Analytics Results for Members Questionnaire tabulation & analysis Forecast accuracy predictive model Accuracy calculations & Benchmarking data review, clean-up and validation Member Inputs Detailed forecast and actual order/sales transaction data Questionnaire responses on business practices and forecasting processes Forecast accuracy and bias intelligence on-demand ONLINE PORTAL 20 62%76%90%89%87%83%55%53%30%40%50%60%70%8 0%90%100%012345 Lag 0 Lag 1 Lag 2 Lag 3 Item-Network 63%81%79%77%83%54%43%40%30%40%50%60%70%8 0%90%100% A Look at Conventional Benchmarks Item-Network and Item-Location FCA (Monthly Buckets) Forecast Accuracy What does this tell you? Are all companies equal?
10 Item-Network 21 Demand Patterns Influence FCA and Bias 81%61%54% of Units Shipped in PatternStableTrendingSeasonal/UpliftInte rmittentLaunch/EndOtherFCABiasMember 2 Member 3 Member 1 More stable and less seasonal and intermittent demand results in higher FCA and lower bias % of Units Shipped in Pattern Stable Launch/End Trending Other Seasonal/Uplift Intermittent FCA Bias 22 S&OVC Demand Segmentation Enables Apples-to-Apples Benchmarking DEMAND VARIABILITY LAG DEMAND PATTERNS DEMAND VELOCITY 23 Company FCA Performance vs. Forecastability Apples-to-Apples Benchmarking 24 SOVC Sample Deliverable FCA Policy Analysis for Monthly Forecasters Do Frequent Parameter UpdatesUse Top Down ProcessBegin Top Down at Product Group LevelInvolve Finance/SC in AdjustmentsDo Not Set Up Separate Promo DFUsEmploy Inventory OptimizationUpdate Inventory Targets WeeklyUse Customized Forecasting ToolUse Moving Average Time-SeriesUse Regression Trend Time-SeriesPolicies of Top PerformersDo Frequent Parameter UpdatesUse Top Down ProcessBegin Top Down at Product Group LevelInvolve Finance/SC in AdjustmentsDo Not Set Up Separate Promo DFUsEmploy Inventory OptimizationUpdate Inventory Targets WeeklyUse Customized Forecasting ToolUse Moving Average Time-SeriesUse Regression Trend Time-SeriesPolicy Profile for Member 1 PRACTICE 2 PRACTICE 3 PRACTICE 4