Transcription of Lexile* Grade Level Conversion Chart
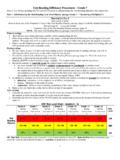
1 Lexile* Grade Level Conversion Chart Lexile Rating Educational Grade - Level Lexile Rating Educational Grade -Level25 675 50 700 75 725 100 750 125 775 150 800 175 825 200 850 225
2 875 250 900 275 925 300 950 325 975 350 1000 375 1025 400 1050 425 1075
3 450 1100 475 1125 500 1150 525 1175 550 1200 575 1225 600 1250 625 1275 650 1300
4 This Conversion Chart is based on educational levels from the published Lexile Framework Chart . A smoothed curve was fit through the Grade - Level points indicated here, and regression analysis provided the equations: Lexile=500Ln( Grade Level ) or, the counterpart GradeLevel= (Lexile) The resulting regression equation was then used to calculate the educational Grade -levels in the above table. A separate study of over 700 titles confirmed that their Accelerated Reader (Advantage Learning s reading management software) reading levels and Lexile ratings are correlated, and that regression analysis on published Accelerated Reader and Lexile reading levels produces a very similar Conversion equation.
5 * Lexile and Lexile Framework are trademarks of Metametrics, Inc. Advantage Learning Systems, Inc.