Transcription of Life Cycle Greenhouse Gas Emissions from Electricity ...
1 Photo by Dennis Schroeder, NREL 22610 Life Cycle Greenhouse Gas Emissions from Electricity Generation: UpdateAs clean energy increasingly becomes part of the national dialogue, lenders, utilities, and lawmakers need the most comprehensive and accurate information on Greenhouse gas (GHG) Emissions from various sources of energy to inform policy, planning, and investment decisions. Since the National Renewable Energy Laboratory (NREL) published original results from the Life Cycle Assessment Harmonization Project (Heath and Mann 2012), it has updated estimates of Electricity generation GHG Emissions factors as part of several recent studies. This fact sheet updates an earlier version (NREL 2013).
2 Systematic Review NREL considered approximately 3,000 published life Cycle assessment studies on utility-scale Electricity generation from wind, solar photovoltaics, concentrating solar power, biopower, geothermal, ocean energy, hydropower, nuclear, natural gas, and coal technologies, as well as lithium-ion battery, pumped storage hydropower, and hydrogen storage technologies. A systematic review, comprising three rounds of screening by multiple experts, selected references that met strict criteria for quality, relevance, and transparency. Less than 15% of the original pool of references passed this review process. The addition of battery and hydrogen storage technologies introduces a unique set of challenges and assumptions to the compilation of Emissions factors.
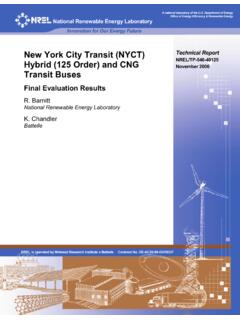
3 The primary challenges stem from the fact that storage technologies are characterized by two different types of capacity Energy Capacity: how much energy a given resource can store, denoted in units of kilowatt hours (kWh) Power Capacity: how much energy a given resource can deliver, denoted in units of kilowatts (kW ).Life Cycle Assessment of Energy SystemsLife Cycle assessments (LCA) can help quantify environmental burdens from cradle to grave and facilitate more-consistent comparisons of energy technologies. Figure 1. Generalized life Cycle stages for energy technologies Background EconomyOperation Combustion Maintenance OperationsDownstream Dismantling Decommissioning Disposal and RecyclingUpstream Resource Extraction Material Manufacturing Component Manufacturing ConstructionFuel Cycle Resource Extraction/ Production Processing/Conversion Delivery to SiteLife Cycle GHG Emissions from renewable Electricity generation technologies are generally less than from those from fossil fuel-based technologies, according to evidence assembled from the LCA Harmonization project.
4 Further, the proportion of GHG Emissions from each lifecycle stage differs by technology. For fossil-fueled technologies, fuel combustion during operation of the facility emits the vast majority of GHGs. For nuclear and renewable energy technologies, most GHG Emissions occur upstream of : Sathaye et al. 2011 Life Cycle Greenhouse Gas Emissions from Electricity Generation: Update 1 Also, certain storage technologies, especially lithium-ion batteries, can be designed to operate for a variety of grid services, such as time-shifting or frequency regulation. To align the estimates of GHG Emissions impacts from the storage technologies with those of other generation technologies, we considered only references that enabled the calculation of Emissions per unit of Electricity delivered over the lifetime of the storage system.
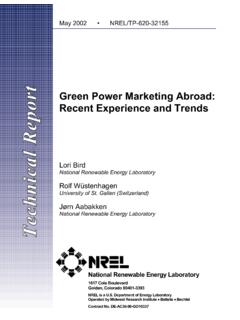
5 Thus, we have excluded references that report only Emissions factors per unit of power estimates of life Cycle GHG Emissions for biomass, solar (photovoltaics and concentrating solar power), geothermal, hydropower, ocean, wind (land-based and offshore), nuclear, oil, and coal generation technologies as well as storage technologies are compared in Figure 2. These estimates are drawn from three groups of studies: Studies conducted as part of NREL s Life Cycle Assessment Harmonization Project ( Life Cycle Assessment Harmonization, NREL, ) Department of Energy vision studies, including Hydropower Vision (DOE 2016), Wind Vision (DOE 2015), Geothermal Vision (Millstein et al. 2019) and On the Path to SunShot (Wiser et al.)
6 2016) Grid-scale lithium-ion battery and hydrogen fuel cell stationary storage literature compiled under the Los Angeles 100% Renewable Energy Study (Nicholson et al. 2021)1,8001,6001,4001,2001,0008006004002 000-200-400-600-800-1,000-1,200-1,400-1, 600 Life Cycle Greenhouse Gas Emissions (g CO2e/kWh)BiopowerPhotovoltaicConcentrati ng Solar PowerGeothermal EnergyHydropowerOcean EnergyWind EnergyPumped Hydropower StorageHydrogen StorageLithium-Ion Battery StorageNuclear EnergyNatural GasOilCoal276 (+4)57 (+2)EstimatesReferences46173610351514922 1051866916429311992780 (+13)47 (+11)2410** Avoided Emissions , no removal of GHGs from the atmosphereElectricity Generation Technologies Powered by Nonrenewable ResourcesElectricity StorageTechnologiesElectricity Generation Technologies Powered by Renewable ResourcesMaximumQ3 MedianQ2 MinimumSingle Estimate for HydrogenSingle Estimates with CCS164 (+11)53 (+9)Figure 2.
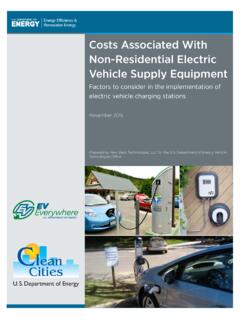
7 Life Cycle Greenhouse gas emission estimates for selected Electricity generation and storage technologies, and some technologies integrated with carbon capture and storage (CCS). Notes for Figure 2: The number of estimates is greater than the number of references because many studies considered multiple scenarios. Numbers reported in parentheses pertain to additional references and estimates that evaluated technologies with Cycle Greenhouse Gas Emissions from Electricity Generation: Update 2 Table 1 includes the median values for four life Cycle phases (one-time upstream ( , materials acquisition and plant construction), ongoing combustion (where applicable), ongoing noncombustion ( , operation and maintenance), and one-time downstream ( , plant decommissioning and disposal/recycling)) as well as a total life Cycle Emissions factor.
8 These results show that total life Cycle GHG Emissions from renewables and nuclear energy are much lower and generally less variable than those from fossil fuels. For example, from cradle to grave, coal-fired Electricity releases about 20 times more GHGs per kilowatt-hour than solar, wind, or nuclear Electricity (based on median estimates for each technology). Note that because different numbers of references may be used in the calculation of each entry in Table 1, the sum of the median estimates of each life Cycle phase for a given generation technology might not equal the median of the total life Cycle Emissions factors (the sum of the medians need not equal the median of the sums). Indeed, the sum of the individual phase median values may be greater than the median total, as is the case with concentrating solar TechnologyRenewableStorageNonrenewableEP RI 2013 Renewable Electricity Futures Study 2012 Kim et al.
9 2012 Hsu et al. 2012 NREL 2012 Burkhardt et al. 2012 Eberle et al. 2017 DOE 2016 IPCC 2011 DOE 2015 DOE 2016 Nicholson et al. 2021 IPCC 2011 Whitaker et al. 2012 Khan et al. 2005 Warner and Heath 2012O Donoughue et al. 2013 NRNRNRNR~ ~ < 389NR1010 BiomassPhotovoltaicaGeothermalOceanNucle ardNatural gasOilCoalHydropowerWindcConcentrating Solar PowerbPumped-storage hydropowerLithium-ion batteryHydrogen fuel cellNR~ <5 One-Time DownstreamOne-Time UpstreamTotal Life CycleOngoing CombustionSourcesOngoing Non CombustionNotes for Table 1 All values are in grams of carbon dioxide equivalent per kilowatt-hour (g CO2e/kWh)a Thin film and crystalline siliconb Tower and troughc Land-based and offshored Light-water reactor (including pressurized water and boiling water) onlyNR = Not AlsoGeneral information about life Cycle assessments.
10 Life Cycle Assessment Harmonization, NREL, visualization and data downloads: LCA Harmonization, OpenEI, distributional statistics and subtechnology Emissions factors augmenting Table 1: 1. Median Published Life Cycle Emissions Factors for Electricity Generation Technologies, by Life Cycle PhaseFunding for this fact sheet was provided by the Joint Institute for Strategic Energy Analysis in support of its Energy and Atmospheric Systems Catalyzer, a collaborative effort that explores the multidirectional relationships across climate, air quality, and energy Cycle Greenhouse Gas Emissions from Electricity Generation: Update 3 National Renewable Energy Laboratory 15013 Denver West Parkway, Golden, CO 80401 303-275-3000 prints on paper that contains recycled is a national laboratory of the Department of Energy Office of Energy Efficiency and Renewable Energy Operated by the Alliance for Sustainable Energy, LLCR eferencesBurkhardt III, John J.