Transcription of Lifetime Likelihood of Victimization
1 , Department of Justice Bureau of Justice Statistics .,. Lifetime Likelihood of Victimization by Het'bert Koppel BJS Analyst This report provides estimates of the Likelihood that a person will become a victim of crime during his or her life-time, or that a household will be vic-timized during a 20-year pel'iod. This contrasts with the conventional use of a I-year period in measuring crime and criminal Victimization . Most promi-nently, the National Crime Survey (NCS) surveys a sample of house-holds and publishes annual Victimization rates, and the FBI's Uniform Crime Reports (UCR) provide annual rates of crimes reported to the police. Annual Victimization rates Annual Victimization rates alone do not convey the fun impact of crime as it affects people. No one would express his or her concern by saying, "I am ter-ribly afraid of being mugged between January and December of this year." People are worried about the possibility that at some time in their lives they will be robbed or raped or assaulted, or , their homes will be burglarized.
2 Annual rates can provide a false sense of security by masking the real impact of crime. Upon hearing that the homicide rate is about 8 to 10 per 100,000 population, one feels safe; after all, 1 chance in 10,000 is not very frightelling. Actually, however, at recent homicide rates about 1 of every 133 Americans will become a murder victim; for black males the prop~rtion is estimated to be 1 of every 30. Similarly, While 16 out of 10,000 women Mat'ch 1987 The Bureau of Justice Statistics National Crime Survey provides annual Victimization rates based on counts of the number of crimes reported and not reported to police in the United States. These rates are based on interviews twice a year with about lOl,OOO persons in approximately 49,000 na tionally representative households. Those annual ra ces, while of obvious utility to policymakel's, researchers, and statisticians, do not convey to American citizens the full impact of crime on them nor do they answer a critical question for each individual: What is the possibility that I will be a crime victim?
3 This technical repot't is designed to shed light on this question. Steven R. Schlesinger Director are rape victims annually, the Lifetime chances of suffering a rape are much gl'eater. Certainly, annual rates are useful. A I-year period is probably optimum for researchers, stati~ticians, and plan-ners. It encompasses exactly one cycle of seasonal variation. It is long enough to smooth out the impact of extraordi-nary events (such as a mass murder in a small city) and to allow time for col-lecting and analyzing data. On the other hand, a I-year period is short enough to show changes and trends in crime rates. The problem lies with people's perception of the meaning of annual ra tes with respect to their own lives. If the Earth revolved around the sun in 180 days, all of our annual crime rates would be halved, but we would not be safer. Calculating Lifetime Victimization fates For this report, Lifetime likelihoods of Victimization were calculated from NCS annual rates and life tables published by the National Center for Health The probability that a person will be victimized at a particular age basically depends upon (a) the probability that the person is still alive at that age and (b) the prob-ability that a person of that age will be victimized.
4 The Lifetime Likelihood of personal Victimization is derived from the probabilities of being victimized at the various ages that constitute a life-time. A similar method is used for cal-culating the long-term Likelihood of crimes against households. Because of the assumptions involved in the calculations and because the data derive from a sample survey, the num-bers presented in this report are estima tes only; they Should be inter-preted only as indications of approxi-mate magnitude, not as exact mea-sures. Essentially they are calcula ted values of Lifetime rlsl< rather than des-criptions of what has been observed. For the purposes of this report, a " Lifetime " begins at age 12. This is dic-tated by the data available from the NCS, which does not cover persons younger than 12 years old. Also, "series" victimizations, those repre-senting three or more similar incidents about which the victim could not pro-vide detail on each event separately, have been excluded. If series victimi-zations were included in the calcula-tions as representing one crime inci-dent, the total number of annual violent victimizations would increase by ap-proximately 8%.
5 The exclusion of series victimizations, then, results in an to some degree of the actual probabilities of Victimization , especially with regard to multiple vic-timizations. Assumption of constant 8 IUlUal rates The estimates of Lifetime Likelihood of Victimization are derived under the assumption that, throughout their life-times, people in the have incurred, and will continue to incur, criminal Victimization at the same annual rates as were observed in the years 1975 through 1984. Calculations are based upon the average annual Victimization rates for 1975-84 (except that data for rape are for 1973-82). Annual victimi-zation rates for the population, and for any group within the population, are assumed to remain constant at the average levels recorded for those years. For example, it is assumed that the rate at which white females of age 34 become victims of assault was the same in the past and will be the same in the future as it was in 1975-84. To the extent that annual rates were different in the past 01' may change in the future, the estimates of Lifetime Victimization are inaccurate.
6 Of course Victimization rates actu-ally vary from year to year. Victimiza-tion data are not available for years before the mid-1970s (when the NCS was started), but crime rates as t'epor-ted by UCR indicate that annual vic-timization rates probably were lower then than in the period 1975-84. The UCR data, however, are not suitable for estimating Lifetime Victimization because they include only crimes repor-ted to the police, and because there is no information about the age, sex, or race of the victims . Since 1981, annual Victimization rates reported by NCS have declined. If this trend were to continue, the Lifetime Victimization probabilities would decrease. Becau~e there is very li ttle usable information about past variation in annual Victimization rates, and because future changes are unpredictable in both direction and magnitude, there is , i no feasible alternative to assuming con-stant values. The Lifetime Likelihood of victimiza-tion can be interpreted as an estimate of a person's entire Lifetime experience, starting in years prior to 1975-84 and continuing into the future until the per-son's death.
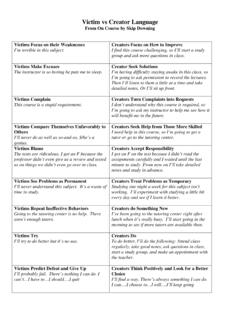
7 Such an estimate is subject to two sources of error that result from assuming constant annual rates: (1) the probable overestimation of victimiza-tion rates in past years, and (2) the uncertainty regarding future annual rates. Estimates of this type are shown Table 1. Lifetime Likelihood of Victimization in table 1. Alternatively, the estimate can be restricted to the future, by taking into account only those victimi-zations that will be incurred in the remainder of the person's Lifetime , starting at his or her current age. This eliminates errors due to past changes in annual rates. Estimates using the latter option are presented in table 2; the values in table 1 constitute such estimates for persons whose current age is 12. Percent of persons who will be victimized by crime starting at 12 :lears of age Total One or more Number of victimizations victimizations c>ne fwo 'l'nree or more Violent crimes, total* Total popula tion 83% 30% 27% 25% Male 89 24 27 38 Female 73 35 23 14 White 82 31 26 24 Male 88 25 27 37 Female 71 36 22 13 Black 87 26 27 34 Male 92 21 26 45 Female 81 31 26 24 Violent crimes, completed* Total population 42% 32% 9% 2% Male 48 34 11 3 Female 36 28 6 1 White 41 31 8 2 Black 53 35 13 4 Rape Total female 8% 8% --White 8 7 --Black 11 10 1 -Robbery Total population 30% 25% 5% 1% Male 37 29 7 1 Female 22 19 2 -White 27 23 4 -Black 51 35 12 4 Assault Total popUlation 74% 35% 24% 15% Male 82 31 26 25 Female 62 37 18 7 White 74 35 24 16 Black 73 35 25 12 Robbery or assault resulting in injury Total population 40% 30% 7% 2% Personal theft To tal popula tion 99% 4% 8% 87% Male 99 3 8 88 Female 99 4 10 84 White 99 4 9 87 Male 99 3 8 88 Female 99 4 10 86 Black 99 5 12 81 Male 99 5 10 84 Female 98 7 15 76 Note.
8 Data are based on average Victimization rates measured by the National Crime . Survey for 1975-84, except for rape data, which are based on Victimization rates for 1973-82. All crimes include attempts except where noted. See box on page 4 for crime definitions. -Less than Includes rape, robbery, /lnd assault. Personal Victimization rates Based on 1975-:84 annual victimiza-tion rates, an estimated 5 out of 6 people will be victims of violent crimes (rape, robbery, and assault), either completed or attempted, at least once during their lives (table 1). (For the precise definitions of the crimes dis-cussed in this report see the "Crime -definitions" box on page 4.) About half the population will be victimized by violent crime more than once. Males are somewhat more likely to become victims than females. The greatest contrast is in multiple victimizations. It is estimated that more than 2 in 5 black males will be victimized by a violent crime three or more times. This is almost double the Likelihood for blacl< females and more than triple the Likelihood for white females.
9 When attempted crimes are exclu-ded, the differences in Lifetime victimi-zation rates between blacks and whites are greater. About 5 in 10 blacks, com-pared with 4 in 10 whites, will suffer a completed violent crime. Based on 1973-82 rates, nearly 1 out of 12 females will be the victim of a completed or attempted rape. The estimated rate for black females is 1 out of 9. It is estimated that 3 in 10 persons will be victims of a completed or at-tempted robbery during their life-times. The victim's sex and race ap-pear to have a greater effect upon the Lifetime Likelihood of Victimization for robbery than for other crimes. Blacks are almost twice as likely to be robbed as whites; males are about 70% more likely to be robbed than females. About 3 out of 4 people will become victims of a completed or attempted assault; 2 in 5 will be victims of this crime at least twice. Males are more likely to be assaulted than females, but the Likelihood is nearly the same fot blacks and whites.
10 At 1975-84 Victimization rates, an estimated 2 in 5 persons will be injured as the result of a robbery or assault; about 1 in 10 will be injured more than once. (Injul'ies reported by the NCS range from minor to life threatening.) According to these estimates, nearly everyone will be the victim of a personal theft at least once, with about 7 in 8 persons being victimized three or more times. In general, findings for Table 2. Lifetime Likelihood or Victimization , by ege Percent of persons who will be victimized by crime starting: at various ag::es Total One or more Number of victimizations victimizations One Two Three or more Violent crimes. Current age 12 years old 83% 30% 27% 25% 20 72 36 23 14 30 53 35 13 4 40 36 29 6 1 50 22 19 2 -60 14 13 1 -70 8 7 --Robbery or' assault resulting in injury Current age 12 years old 40% 30% 7% 2% 20 30 25 4 1 30 19 17 2 --40 11 U 1 -50 7 6 --60 4 4 --70 2 2 --Personal theft CUrrent age 12 years old 99% 4% 8% 87% 20 98 9 16 73 30 93 19 25 48 40 8~ 31 19 33 50 64 37 19 8 60 43 32 9 2 70 24 21 3 -Note: Data are based on average Victimization rates measUl'ed by the National Crime Survey for 1975-84.