Transcription of Line Plots
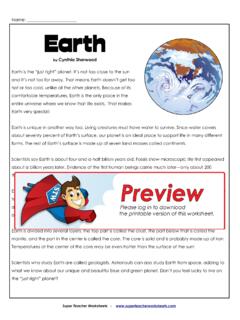
1 Name: _____Line PlotsMr. Bradley is very proud of all the students in his science class. They all studied hard and did an excellent job on last week's science test. Everyone in the class scored an 88% or higher! The line plot below shows the score distribution. 1. How many students received a score of 94%?_____ 2. What was the highest score in the class?_____ 3. What was the lowest score in the class?_____ 4. How many students received a score in the 80s?_____ 5. How many students received a score in the 90s?_____ 6. How many students scored 93% or less?
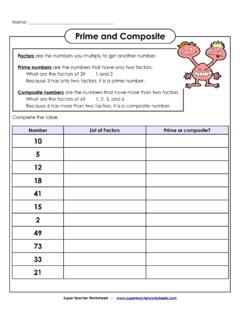
2 _____ 7. How many students are in Mr. Bradley's science class?_____ 8. Mr. Bradley decides to give each student two percentage bonus points on their last test for participating in class. Explain how you could change the graph to showthe new test Teacher Worksheets - KEYLine PlotsMr. Bradley is very proud of all the students in his science class. They all studied hard and did an excellent job on last week's science test. Everyone in the class scored an 88% or higher! The line plot below shows the score distribution. 1. How many students received a score of 94%?
3 2 2. What was the highest score in the class?98% 3. What was the lowest score in the class?88% 4. How many students received a score in the 80s?10 students 5. How many students received a score in the 90s?17 students 6. How many students scored 93% or less?16 students 7. How many students are in Mr. Bradley's science class?27 students 8. Mr. Bradley decides to give each student two percentage bonus points on their last test for participating in class. Explain how you could change the graph to showthe new test nu mber on the numb er line at the bottom of the graph would increase by Teacher Worksheets.