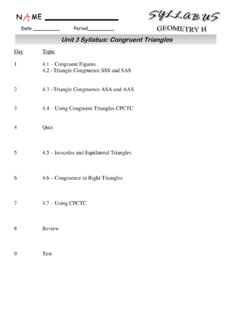
Transcription of Lines of Fit: Prac tice D - GradeAmathelp.com: Free …
1 Created by , all rights reserved. 1. Look at the data in the table below x 0 4 8 13 17 22 y 34 27 16 8 5 -3 Which of the following describes the slope of the line of best fit for this data? a. The slope is positive b. The slope is negative c. The slope is zero d. The slope is undefined 2. Look at the graph below with a line of best fit already drawn in. Answer the questions: 3. What calculator buttons do you need to push to find the equation of a line of best fit? Date _____ Period_____ Lines of Fit: Practice D y x 0 1 2 3 4 5 6 7 8 9 10 Hours Worked Dollars Earned 80 72 64 56 48 40 32 24 16 8 0 Earnings at Work Questions about the line of Fit 1.
2 How many dollars did Jim earn for working 5 hours? 2. Using your line of fit, predict how many dollars Jim will earn for working 10 hours. 3. Is the slope of your line of fit positive or negative? 4. According to the line of fit, when Jim s hours increase by 5, how much do his earnings increase? Created by , all rights reserved. 4. Every year since 1998, Number of cases of Chicken Pox has declined. a) Label each axes shown above with numbers and words! b) Plot the points on the graph c) Find the equation of the line of best fit by using the calculator. d) Predict how many cases of chicken pox (in millions) there will be in the year 2010 5. Look at the table shown below: x -10 -7 -4 1 4 5 y 3 5 12 13 17 19 a.
3 What is the equation of the line of best fit? b. Predict what y will be when x = 25 (approximately) c. Predict what x will be when y = -12 (approximately) Year Year since 1998 Cases of Chicken Pox (millions) 1998 10 1999 9 2000 2001 2002 2003 2004 Created by , all rights reserved. 6. Created by , all rights reserved. 7. The scatter plot below shows the relationship between games played and tickets won. Which of the graphs below represents the line of best fit? 8. The scatter plot below shows the relationship between hours spent shopping and money. Which of the graphs below represents the line of best fit? Tickets Won Games Played Tickets Won Games Played Tickets Won Games Played Tickets Won Games Played A) B) C) Money Hours Spent Shopping A) B) Money Hours Spent Shopping Money Hours Spent Shopping Money Hours Spent Shopping C)