Transcription of Literacy Rates Continue to Rise from One ... - UNESCO UIS
1 Fact Sheet No. 45. September 2017. FS/2017/LIT/45. Literacy Rates Continue to Rise from One Generation to the Next The UNESCO Institute for To celebrate International Literacy Day on 8 September, this fact sheet Statistics (UIS) is the official presents the latest available Literacy data from the UNESCO Institute for source of internationally- Statistics (UIS) and an overview of national, regional and global trends over comparable data on the past five decades. education and Literacy used to monitor progress The data show remarkable improvement among youth in terms of reading and towards the Sustainable writing skills and a steady reduction in gender gaps. 50 years ago, almost one- Development Goals. quarter of youth lacked basic Literacy skills compared to less than 10% in 2016. However, 750 million adults two-thirds of whom are women remain illiterate @ UNESCO stat (see Box 1 on methodological changes).
2 Renewed efforts are therefore needed to reach the new Literacy target of the Sustainable Development Goals (SDGs): by 2030, ensure that all youth and a substantial proportion of adults, both men and women, achieve Literacy and numeracy . The data are available via the UNESCO eAtlas of Literacy , which features interactive maps and charts that can be shared and downloaded at Global Literacy trends today Although Literacy has been high on the development agenda over the past decades, UIS data show that 750 million adults two-thirds of whom are women . still lack basic reading and writing skills, according to the latest available data for 2016 (see Table 1). 102 million of the illiterate population were between 15 and 24. years old. The global adult Literacy rate was 86% in 2016, while the youth Literacy rate was 91%. According to UIS data, the majority of countries missed the Education for All (EFA).
3 Goal of reducing adult illiteracy Rates by 50% between 2000 and 2015. At the global level, the adult and youth Literacy Rates are estimated to have grown by only 4%. each over this period. 2 UIS Fact Sheet No. 45 | September 2017. In line with the new monitoring framework , all regional data presented here refer to SDG Box 1. Methodological changes to improve the accuracy of Literacy Rates and numbers The UIS has introduced several methodological changes to improve the accuracy of its Literacy Rates and numbers. One effect of these changes is an overall rise in adult Literacy Rates and a corresponding decrease in the illiterate population, which largely explains the apparent decrease in the global number of illiterate adults from 758 million reported last year for 2014 to 750 million reported this year for 2016. In the past, data from the most recent year available were used for many countries, rather than projections for the reference year for the current release.
4 Starting this year, the UIS is using estimated Literacy Rates produced with its Global Age-Specific Literacy Projections (GALP) model for all years when national data are missing. For example, for Brazil, China and India, data for 2013, 2010 and 2011, respectively, were used in the calculation of regional averages for 2014 published by the UIS in 2016. By contrast, regional averages for 2016 published in 2017 make use of projections for 2016 for all countries. This change in methodology also allows the calculation of regional averages for each year, rather than each decade, and has thus resulted in the production of more recent and timely estimates for Literacy . In addition to this methodological change, the UIS has also received new or revised data for many countries. In some cases, this has resulted in very different estimates of the adult Literacy rate than previously published.
5 For example, new data for Bangladesh show an adult Literacy rate of 73% in 2016. compared with 47% in 2011, resulting in a reduction of the estimated illiterate population for the country. For the reasons outlined above, regional averages including estimates of the illiterate population are not comparable across data releases. Instead, the most recent time series published by the UIS should be used to examine changes in regional and global Literacy Rates and numbers between years. For example, in 2016 the UIS estimated that the global adult illiterate population was 758 million in the 2014. reference year, but this estimate for 2014 has now been revised downward to 755 million, based on the most recent national data and revised methodology. 1. The SDG region Central and Southern Asia is presented in this fact sheet as two separate regions given the very different patterns of Literacy in the two sub-regions.
6 Data for the SDG region Oceania are not available. 3 UIS Fact Sheet No. 45 | September 2017. Table 1. What are the latest Literacy figures? Global Literacy Rates and illiterate population by age groups, 2016. Adults Elderly Youth Population (aged 15 (aged 65. Indicator (aged 15-24 aged 25-64. years and years and years) years older) older). Global Literacy rate (%). Both sexes 86 91 86 78. Men 90 93 90 83. Women 83 90 82 73. Gender parity index Global illiterate population (millions). Both sexes 750 102 507 141. Men 277 44 186 47. Women 473 58 321 94. Share of women (%) 63 57 63 67. Source: UNESCO Institute for Statistics, July 2017. Regions with the largest illiterate populations and countries with the lowest Literacy Rates Southern Asia is home to almost one-half of the global illiterate population (49%). In addition, 27% of all illiterate adults live in sub-Saharan Africa, 10% in Eastern and South-Eastern Asia, 9% in Northern Africa and Western Asia, and about 4% in Latin America and the Caribbean.
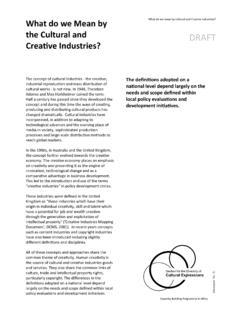
7 Less than 2% of the global illiterate population live in the remaining regions combined (Central Asia, Europe and Northern America, and Oceania). The lowest Literacy Rates are observed in sub-Saharan Africa and in Southern Asia (see Figure 1). Adult Literacy Rates are below 50% in the following 20 countries: Afghanistan, Benin, Burkina Faso, Central African Republic, Chad, Comoros, C te d'Ivoire, Ethiopia, Gambia, Guinea, Guinea-Bissau, Haiti, Iraq, Liberia, Mali, Mauritania, Niger, Senegal, Sierra Leone and South Sudan. Youth Literacy Rates , for the population aged 15. to 24 years, are generally higher than adult Literacy Rates , reflecting increased access to schooling among younger generations. Nevertheless, youth Literacy Rates remain low in several countries, most of them in sub-Saharan Africa, which suggests problems with low access to schooling, early school leaving or a poor quality of education.
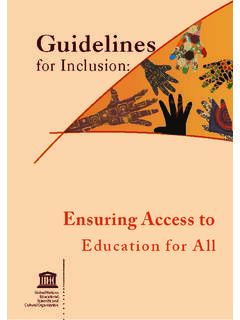
8 4 UIS Fact Sheet No. 45 | September 2017. Figure 1. Where are Literacy Rates lowest and highest in the world? Adult Literacy rate by country, 2016. Youth Literacy rate by country, 2016. Source: UNESCO Institute for Statistics, July 2017. Adult Literacy Rates are at or near 100% in most countries in Central Asia, Europe and Northern America, and Eastern and South-Eastern Asia (see Figure 2). Youth Literacy Rates are highest in the same three regions and in Latin America and the Caribbean. 5 UIS Fact Sheet No. 45 | September 2017. Figure 2. How do Literacy Rates for men and women compare across regions? Adult Literacy rate by region and sex, 2016. Youth Literacy rate by region and sex, 2016. Source: UNESCO Institute for Statistics, July 2017. 6 UIS Fact Sheet No. 45 | September 2017. Gender gaps persist among adults but also youth Figure 2 displays the male and female Literacy Rates in each region.
9 In Central Asia, Europe and Northern America, Eastern and South-Eastern Asia, and Latin America and the Caribbean, there is no or little difference between male and female adult Literacy Rates . On the other hand, there are relatively large gender gaps to the detriment of women in Northern Africa and Western Asia, Southern Asia, and sub- Saharan Africa. Among youth, gender disparities in Literacy skills are generally smaller and improving more quickly over time; this is discussed in more detail in the section on trends over the past decades. The gender parity index (GPI), which is calculated by dividing the female by the male Literacy rate, represents a different way of looking at the relative Literacy skills of men and women. A GPI value below 1. means that the female Literacy rate is below the male Literacy rate, while values between and are generally interpreted to indicate gender parity.
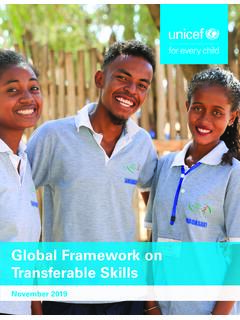
10 Figure 3 shows that four regions have achieved gender parity among adults and youth with regard to Literacy : Central Asia, Eastern and South-Eastern Asia, Europe and Northern America, and Latin America and the Caribbean. Three regions Northern Africa and Western Asia, Southern Asia and sub-Saharan Africa are far from gender parity for the adult population. In Southern Asia and sub-Saharan Africa, GPI values of for the adult Literacy rate indicate that women aged 15 years and older are one-fifth less likely to be literate than men in the same age group. At the global level, women aged 15 years and older are nearly 8% less likely to be literate than men, and young women between 15 and 24 years are 3% less likely to be literate than young men. Figure 3. Which regions have reached gender parity in adult and youth Literacy ?