Transcription of Low Yield Curves and Absolute/Normal Volatilities
1 Low Yield Curves and Absolute/Normal VolatilitiesSummaryIn this paper, we look at the changes that have occurred in interest rate markets since the financial crisis. We consider how insurers can address the challenge of low and (more recently) negative Yield Curves as central banks have responded to challenging economic conditions with a range of unconventional monetary policies. Different measures of swaption implied Volatilities have emerged as market standards for quoting derivative prices. We review and discuss the advantages of using Absolute/Normal Volatilities in the current interest rate environment. Finally, the implications of a move to Absolute/Normal Volatilities are discussed in the context of Market Consistent valuation for insurance companies.
2 WHITEPAPERMARCH 2016 AuthorNick JessopMoody s AnalyticsContact Us+44 20 7772 MARCH 2016 LOW Yield Curves AND Absolute/Normal VOLATILITIESMOODY S ANALYTICSCONTENTSSUMMARY ..1 INTRODUCTION ..3 NEW PERSPECTIVES ON INTEREST RATE Volatilities ..4 IMPLICATIONS FOR INSURERS ..7 Moneyness of Guarantees? ..7 Which swaption convention to use when you use a non-swap curve (for example European Insurance Occupational Pensions Authority (EIOPA), government, AA rated) calibrations? ..8 Which swaption convention to use with EIOPA Curves with/without Yield curve adjustments? ..8 Which swaption convention is appropriate to use for Solvency II standard formula and Swiss Solvency Test (SST)?
3 8 Which swaption convention to use when calculating financial exposures like effective durations and convexities? ..8 Evaluating fit to market, volatility extrapolation, and volatility anchoring ..8 Correlation between volatility and Yield Curves ..8 Risk decomposition ..9 Hedging interest rate risk ..9 Real world modeling ..9 Alignment with the Banking ..9 APPENDIX SWAPTION IMPLIED VOLATILITY FORMULAS ..103 MARCH 2016 LOW Yield Curves AND Absolute/Normal VOLATILITIESMOODY S ANALYTICSI ntroduction Almost ten years after the financial crisis, interest rates, and yields Curves across the globe are different from their long-term historic norm.
4 Short rates, the mainstay of monetary policy before the crisis, have been pinned to the floor for a prolonged period. Exhibit 1 shows the accelerated fall during the crisis and the subsequent period of consistently low rates. Exhibit 1: Short rates before and since the financial crisis. In many central banks views, the global financial crisis led to a need for large negative real interest rates. When inflation is low, imposing negative real rates is difficult and Quantitative Easing (QE) was embraced as a workable proxy. This form of monetary policy response quickly became the norm in most of the large global economies, with QE introduced in the US and UK in 2008, and in Japan in 2011.
5 The intention of QE was to force longer term yields lower by purchasing government bonds and other longer dated financial assets, in combination with clear future guidance that policy rates would stay low for a prolonged period of time. The impact has been an extended period of low-cost financing for households, banks, the commercial sector, and governments. The Eurozone and its neighbors reactions have been slower and less decisive. Between 2008 - 2014 longer term yields in the Eurozone were pulled lower by the broader global trends. However, it was not until January 2015 that the European Central Bank announced its own program of quantitative easing.
6 The impact of this late venture into unconventional monetary loosening has been a lowering of longer term yields and rates in the Eurozone and Sweden introducing its own parallel program of easing. Even less conventional forms of monetary response have also been tried. The most notable of these measures is the imposing of negative nominal interest rates. The fundamental barrier to setting negative real rates directly was a perceived hard floor on nominal rates, with the consensus being that nominal rates could not become negative. This view is challenged by the introduction of negative nominal rates in Sweden, Switzerland, the Eurozone and Japan (exhibit 2).
7 In these economies, it became evident that Central Banks could charge for deposits and investors would, in certain situations, pay for the security of sovereign bonds for periods of up to ten years. The Federal Reserve included a negative rate scenario in their 2016 stress MARCH 2016 LOW Yield Curves AND Absolute/Normal VOLATILITIESMOODY S ANALYTICSE xhibit 2: Negative Yields at end Q1 other notable Central Bank action was Switzerland s September 2011 decision to introduce, without notice, a floor on the Swiss Franc to Euro exchange rate provoking one of the largest one day moves in Foreign Exchange (FX) ever experienced. This floor was held for almost 4 years, until it was dropped days before the Eurozone QE announcements in January paper aims to help understand the challenges faced in the use of Black s formula in the current economic environment of low yields Curves , and demonstrate how the usage of Absolute/Normal implied Volatilities can address them.
8 New Perspectives on Interest Rate VolatilitiesThe long standing convention of quoting derivative prices for interest rate options like caps, floors, and swaptions is to use Black s formula for option pricing which assumes a lognormal distribution for interest rates. Historical Black implied Volatilities for one month into one year Euro swaptions since 1999 can be seen in Exhibit 3. Before 2008, Black Volatilities typically varied between 10% and 30% with a clear inverse relationship between the level of implied Volatilities and rates. As rates fell in response to the financial crisis in 2008, Black Volatilities changed. Since 2009 there appears to have been three distinctive volatility regimes.
9 The first was between 2009 and mid-2012 when Black Volatilities varied between 30% and 70%. The second (following rates cuts to about 50 basis points (bp)) was the period between mid-2012 and mid-2014 when Black Volatilities varied between 80% and 170%. Finally, a further cut in rates in mid-2014 too close to zero percent led to Volatilities greater than 200%. In each circumstance, the reason for the increase in volatility regime was a drop in the underlying level of rates. Similar sensitivities of Black implied Volatilities to rates are seen in different markets and for different tenor/maturity combinations. 5 MARCH 2016 LOW Yield Curves AND Absolute/Normal VOLATILITIESMOODY S ANALYTICSE xhibit 3: Black swaption implied Volatilities for the Eurozone.
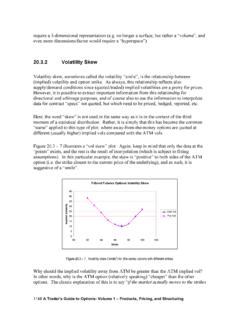
10 Ideally, an implied volatility measure used for pricing interest rate derivatives would hold approximately constant and vary in an intuitive way under a range of market conditions or across different ranges of instruments including: As strike and forward rates change. When maturities and tenors vary. For different types of instrument (for example puts and calls, payers and receivers) linked via put-call 2008 when rates were higher, Black implied Volatilities performed reasonably well against these criteria. However, since 2009 participants in the swaption markets have increasingly chosen to use Absolute/Normal implied Volatilities . In Exhibit 4, we see absolute Volatilities for a range of different economies since 1996 (we have created the series by taking Black implied Volatilities and multiplying by the prevailing swap rate).