Transcription of Machine Learning - University of British Columbia
1 Machine Learning A Probabilistic Perspective Kevin P. Murphy The MIT Press Cambridge, Massachusetts London, England 1 introduction Machine Learning : what and why? We are drowning in information and starving for knowledge. John Naisbitt. We are entering the era of big data. For example, there are about 1 trillion web pages1 ; one hour of video is uploaded to YouTube every second, amounting to 10 years of content every day2 ; the genomes of 1000s of people, each of which has a length of 109 base pairs, have been sequenced by various labs; Walmart handles more than 1M transactions per hour and has databases containing more than petabytes ( 1015 ) of information (Cukier 2010); and so on. This deluge of data calls for automated methods of data analysis, which is what Machine Learning provides. In particular, we define Machine Learning as a set of methods that can automatically detect patterns in data, and then use the uncovered patterns to predict future data, or to perform other kinds of decision making under uncertainty (such as planning how to collect more data!)
2 This books adopts the view that the best way to solve such problems is to use the tools of probability theory. Probability theory can be applied to any problem involving uncertainty. In Machine Learning , uncertainty comes in many forms: what is the best prediction about the future given some past data? what is the best model to explain some data? what measurement should I perform next? etc. The probabilistic approach to Machine Learning is closely related to the field of statistics, but di ers slightly in terms of its emphasis and terminology3 . We will describe a wide variety of probabilistic models, suitable for a wide variety of data and tasks. We will also describe a wide variety of algorithms for Learning and using such models. The goal is not to develop a cook book of ad hoc techiques, but instead to present a unified view of the field through the lens of probabilistic modeling and inference.
3 Although we will pay attention to computational e ciency, details on how to scale these methods to truly massive datasets are better described in other books, such as (Rajaraman and Ullman 2011; Bekkerman et al. 2011). 1. 2. Source: 3. Rob Tibshirani, a statistician at Stanford University , has created an amusing comparison between Machine Learning and statistics, available at ~tibs/stat315 2 Chapter 1. introduction It should be noted, however, that even when one has an apparently massive data set, the e ective number of data points for certain cases of interest might be quite small. In fact, data across a variety of domains exhibits a property known as the long tail, which means that a few things ( , words) are very common, but most things are quite rare (see Section for details). For example, 20% of Google searches each day have never been seen before4.
4 This means that the core statistical issues that we discuss in this book, concerning generalizing from relatively small samples sizes, are still very relevant even in the big data era. Types of Machine Learning Machine Learning is usually divided into two main types. In the predictive or supervised Learning approach, the goal is to learn a mapping from inputs x to outputs y, given a labeled set of input-output pairs D = {(xi , yi )}Ni=1 . Here D is called the training set, and N is the number of training examples. In the simplest setting, each training input xi is a D-dimensional vector of numbers, rep- resenting, say, the height and weight of a person. These are called features, attributes or covariates. In general, however, xi could be a complex structured object, such as an image, a sentence, an email message, a time series, a molecular shape, a graph, etc.
5 Similarly the form of the output or response variable can in principle be anything, but most methods assume that yi is a categorical or nominal variable from some finite set, yi {1, .. , C} (such as male or female), or that yi is a real-valued scalar (such as income level). When yi is categorical, the problem is known as classification or pattern recognition, and when yi is real-valued, the problem is known as regression. Another variant, known as ordinal regression, occurs where label space Y has some natural ordering, such as grades A F. The second main type of Machine Learning is the descriptive or unsupervised Learning approach. Here we are only given inputs, D = {xi }N i=1 , and the goal is to find interesting patterns in the data. This is sometimes called knowledge discovery. This is a much less well-defined problem, since we are not told what kinds of patterns to look for, and there is no obvious error metric to use (unlike supervised Learning , where we can compare our prediction of y for a given x to the observed value).
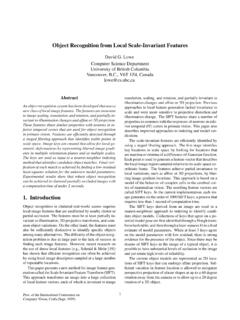
6 There is a third type of Machine Learning , known as reinforcement Learning , which is somewhat less commonly used. This is useful for Learning how to act or behave when given occasional reward or punishment signals. (For example, consider how a baby learns to walk.). Unfortunately, RL is beyond the scope of this book, although we do discuss decision theory in Section , which is the basis of RL. See , (Kaelbling et al. 1996; Sutton and Barto 1998;. Russell and Norvig 2010; Szepesvari 2010; Wiering and van Otterlo 2012) for more information on RL. 4. s-from-google. Supervised Learning 3. (a) (b). Figure Left: Some labeled training examples of colored shapes, along with 3 unlabeled test cases. Right: Representing the training data as an N D design matrix. Row i represents the feature vector xi . The last column is the label, yi {0, 1}. Based on a figure by Leslie Kaelbling.
7 Supervised Learning We begin our investigation of Machine Learning by discussing supervised Learning , which is the form of ML most widely used in practice. Classification In this section, we discuss classification. Here the goal is to learn a mapping from inputs x to outputs y, where y {1, .. , C}, with C being the number of classes. If C = 2, this is called binary classification (in which case we often assume y {0, 1}); if C > 2, this is called multiclass classification. If the class labels are not mutually exclusive ( , somebody may be classified as tall and strong), we call it multi-label classification, but this is best viewed as predicting multiple related binary class labels (a so-called multiple output model). When we use the term classification , we will mean multiclass classification with a single output, unless we state otherwise.
8 One way to formalize the problem is as function approximation. We assume y = f (x) for some unknown function f , and the goal of Learning is to estimate the function f given a labeled training set, and then to make predictions using y = f (x). (We use the hat symbol to denote an estimate.) Our main goal is to make predictions on novel inputs, meaning ones that we have not seen before (this is called generalization), since predicting the response on the training set is easy (we can just look up the answer). Example As a simple toy example of classification, consider the problem illustrated in Figure (a). We have two classes of object which correspond to labels 0 and 1. The inputs are colored shapes. These have been described by a set of D features or attributes, which are stored in an N D. design matrix X, shown in Figure (b). The input features x can be discrete, continuous or a combination of the two.
9 In addition to the inputs, we have a vector of training labels y. In Figure , the test cases are a blue crescent, a yellow circle and a blue arrow. None of these have been seen before. Thus we are required to generalize beyond the training set. A. 4 Chapter 1. introduction reasonable guess is that blue crescent should be y = 1, since all blue shapes are labeled 1 in the training set. The yellow circle is harder to classify, since some yellow things are labeled y = 1. and some are labeled y = 0, and some circles are labeled y = 1 and some y = 0. Consequently it is not clear what the right label should be in the case of the yellow circle. Similarly, the correct label for the blue arrow is unclear. The need for probabilistic predictions To handle ambiguous cases, such as the yellow circle above, it is desirable to return a probability. The reader is assumed to already have some familiarity with basic concepts in probability.
10 If not, please consult Chapter 2 for a refresher, if necessary. We will denote the probability distribution over possible labels, given the input vector x and training set D by p(y|x, D). In general, this represents a vector of length C. (If there are just two classes, it is su cient to return the single number p(y = 1|x, D), since p(y = 1|x, D) + p(y =. 0|x, D) = 1.) In our notation, we make explicit that the probability is conditional on the test input x, as well as the training set D, by putting these terms on the right hand side of the conditioning bar |. We are also implicitly conditioning on the form of model that we use to make predictions. When choosing between di erent models, we will make this assumption explicit by writing p(y|x, D, M ), where M denotes the model. However, if the model is clear from context, we will drop M from our notation for brevity.