Transcription of Making Sense of Your Child’s Test Scores - Wrightslaw
1 Wrightslaw White Paper Making Sense of your child s Test Scores by Melissa Lee Farrall, PhD, SAIF Pamela Darr Wright, MA, MSW Peter Wright, Esq. 2 Copyright 2014 Wrightslaw Executive Summary To be an effective advocate, you need to understand your child s Scores on tests and assessments. Test Scores provide information about your child s abilities, academic achievement, and functional performance. If your child has an Individualized Education Program (IEP), his school team will use Scores from tests and assessments to determine his present levels of academic achievement and functional performance. The Scores will be used to develop goals in his IEP. You need to learn about standardized norm-referenced tests and criterion-referenced tests .
2 You also need to learn about academic and diagnostic assessments, the bell curve, standard Scores , T Scores , stanines, subtest Scores , standard deviations, and percentile ranks. You should never rely on one test or one test score when Making decisions about your child s educational programming and remediation of specific skill deficits. When you understand what test Scores mean, you will be able to use test results to monitor your child s progress. Although test Scores are important, they should not be your only source of information. First, tests may not measure what they appear to measure. Second, all tests do not measure a child s skills comprehensively. Third, even the best tests are not perfectly reliable.
3 When you can make Sense of your child s test Scores , you will be able to answer these questions: What are my child s strengths and weaknesses? What does my child need in his educational program? How can I monitor my child s progress or lack of progress? As your child s advocate, you need to learn how to use test Scores to monitor your child s progress and ensure that it is adequate. 3 Copyright 2014 Wrightslaw Understanding your child s Test Scores Assume you attend an IEP meeting for your child with a learning disability. your child s teachers say, We are so excited. your son earned a score of 85 on the reading test! If your child earns a standard score of 85 (SS = 85) on a test, his percentile rank is 16 (PR = 16).
4 Eighty-four percent of his peers earned higher Scores on the test. Should you be excited to learn that your child earned a percentile rank of 16 in reading? What skills did the reading test measure? Did his Scores improve, stay the same, or drop? Standardized Norm-Referenced tests and Criterion-Referenced tests Standardized, norm-referenced tests are used to assess many areas, including intelligence and academic skills. These tests are also used to measure specific skills required for reading, written language, and math. A standardized test is given the same way to all children. Evaluators follow rules for test administration. Evaluators are not permitted to alter materials or reword questions. Standardized, norm-referenced tests provide valuable information about your child s levels of functioning in the areas tested.
5 Norm-referenced tests also provide a way to evaluate changes in performance, including the impact of educational remediation. What are norm-referenced tests ? Norm-referenced tests are standardized tests that compare one child s performance with the performance of other children in the same age or grade. Norm-referenced tests use scoring systems that are designed to capture a child s skills with respect to the peer group. What are criterion-referenced tests ? Criterion-referenced tests are used to measure knowledge or skills. The child s score is based on mastery of the material and is usually expressed as a percentage. Teachers use criterion-referenced tests to determine if students have mastered material.
6 Classroom spelling and math tests are criterion-referenced tests . A child who spells 8 of 10 words correctly on a spelling test will earn a score of 80%. 4 Copyright 2014 Wrightslaw What are the differences between norm-referenced and criterion-referenced tests ? Norm-referenced tests allow you to compare one child s performance to a representative sample of his peers. You can compare your child s score to Scores of other children who are the same age or in the same grade. Criterion-referenced tests are used to assess academic knowledge and skills in greater depth. For example, a criterion-referenced test can show if your child has mastered specific math facts or phonics skills. Before you can fully understand your child s test Scores , you need to understand a few basic concepts: the bell curve, mean, and standard deviation .
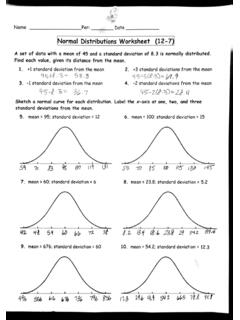
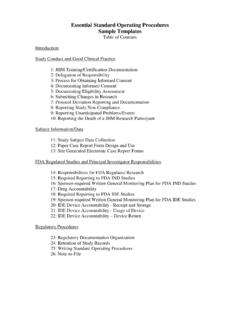
7 When you understand your child s test Scores , you will have the knowledge to change your child s life. The Bell Curve You need to know how your child is performing on tests when compared to other children who are at his age or grade level. The bell curve will provide this information and allow you to create graphs to show progress or lack of progress. The bell curve is a graph showing the percentage of children who earn Scores from low to high. When all Scores are plotted on the graph, it forms a bell shape. Most children are in the average range so the curve is the highest in the middle. There are fewer high and low Scores . Before you can use the bell curve, you need to know the Mean and Standard deviation of a test.
8 The Mean and the Standard deviation are the keys to interpreting test scoring systems. What is the Mean? On the bell curve, the Mean is in the middle, at the 50th percentile. The average or Mean score on most tests is 100 (Mean = 100). tests are made up of subtests. The Mean is usually 10 on subtests (Mean = 10). What are Standard Deviations? The bell curve is measured in units called Standard Deviations (SD). Standard Deviations describe how far test Scores spread out or deviate from the Mean. The center of the bell curve (the Mean) is at 0 (zero) Standard Deviations. A score that is zero Standard Deviations from the Mean is always at the 50th percentile (PR = 50). On the bell curve, the area between one Standard deviation to the right (+1 SD) and 1 Standard deviation to the left (-1 SD) of the Mean represents 68% (about two-thirds) of the population.
9 If we increase the range to two Standard Deviations above (+2 SD) to two 5 Copyright 2014 Wrightslaw Standard Deviations below (-2 SD) the Mean, about 96% of the population is represented. Figure 1. Bell Curve with Mean, Standard Deviations, Subtest Scores , Percentile Ranks A score that is one Standard deviation above the Mean is at or close to the 84th percentile rank (PR = 84). A score that is one Standard deviation below the Mean is at or close to the 16th percentile (PR = 16). On some tests , the percentile ranks are close to, but not exactly at the expected value. A score that is two Standard Deviations above the Mean is at or close to the 98th percentile (PR = 98). A score that is two Standard Deviations below the Mean is at or close to the 2nd percentile (PR =2).
10 Assume for a moment your child earned a score that is one Standard deviation below the Mean (-1 SD). Do you know how your child performed when compared to his peers? Now assume your child earned a score that is one Standard deviation above the Mean (+ 1 SD). How did your child perform when compared to his peers? For answers to these questions, see the Conversion Table in Figure 2, page 8. On most psychological and educational tests , the mean is 100 and the Standard deviation is 15 points. Evaluators usually provide the Mean and Standard deviation in their evaluation report. When you know the Mean and Standard deviation of a test, you can determine how your child is performing when compared to other children who are at his age or grade level.