Transcription of Manufacturing statistics in Great Britain, 2021 - HSE
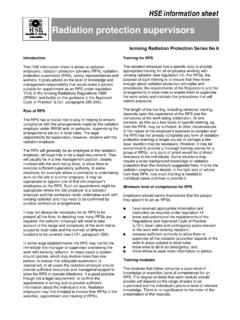
1 Manufacturing statistics in Great Britain, 2021 Data up to March 2021 Annual statistics Published 16th December 2021 Manufacturing statistics in Great Britain, 2021 2 Manufacturing statistics in Great Britain, 2021 3 Table of Contents Key statistics 4 Ill health 4 Fatal injuries 5 Non-fatal injuries 6 Introduction 7 Work-related ill health 8 All illness 9 Musculoskeletal disorders 10 Stress, depression or anxiety 11 Changes over time 12 Lung disorders 15 Workplace injuries 18 Fatal injuries 18 Changes over time 18 Non-fatal injuries 19 Enforcement 22 Annex 1: Sources and definitions 23 Annex 2: Links to detailed tables 25 National statistics 26 Manufacturing statistics in Great Britain, 2021 4 Key statistics Ill health 88,000 workers suffering from work-related ill health (new or long-standing) each year averaged across the three-year period 2018/19-2020/21. In the recent years prior to the coronavirus pandemic, the rate of self-reported work-related ill health had been broadly flat.
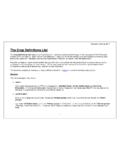
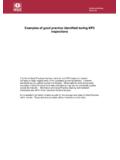
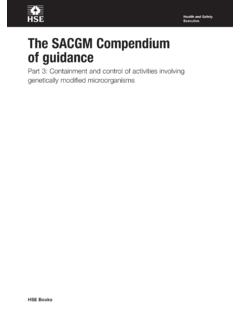
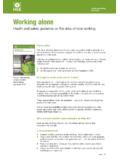
2 In 2020/21 the rate was not statistically significantly different to the 2018/19 pre-coronavirus level. Source: LFS estimated annual average 2018/19-2020/21 Manufacturing statistics in Great Britain, 2021 5 Fatal injuries 20 fatal injuries to workers in 2020/21. This is in comparison with the annual average number of 18 fatalities for 2016/17-2020/21. Source: RIDDOR Source: RIDDOR, 2016/17-2020/21. Accident kinds are shown that account for 10% or more of injuries. Manufacturing statistics in Great Britain, 2021 6 Non-fatal injuries 57,000 Workers sustain non-fatal injuries at work each year averaged across the three-year period 2018/19-2020/21. Prior to the coronavirus pandemic the rate of self-reported non-fatal injury to workers showed a downward trend. The rate for the latest period, which includes years affected by the coronavirus pandemic, is not statistically significantly different from the previous period.
3 Source: LFS, estimated annual average 2018/19-2020/21 Source: Non-fatal injuries reported under RIDDOR 2018/19-2020/21. RIDDOR is used here as the LFS is not able to provide a breakdown to this level of detail. Accident kinds are shown that account for 10% or more of injuries Manufacturing statistics in Great Britain, 2021 7 Introduction This report provides a profile of workplace health and safety in the Manufacturing1 sector. Broadly speaking Manufacturing includes activities that involve the physical or chemical transformation of materials, substances or components into new products. Outputs may be finished products (ready for use) or semi-finished in the sense that it is to become an input for further Manufacturing . The 2007 Standard Industrial Classification (SIC) divides Manufacturing into 24 divisions. For the purpose of this report, to ensure reliable statistical estimates, these 24 divisions have been grouped into 6 broad sub-sectors, namely: Manufacture of food and drink products (SIC 10 and 11).
4 Manufacture of non-metallic products, covering manufacture of: - wood and wooden products (SIC 16); - paper and paper products (SIC 17); - rubber and plastic products (SIC 22); - other non-metallic products such as glass, ceramics, brick, cement and plaster (SIC 23); - furniture (SIC 31). Manufacture of chemical and pharmaceutical products, covering manufacture of: - coke and refined petroleum products ( petrol refinery) (SIC 19); - manufacture of chemicals and chemical products, which includes the transformation of organic and inorganic raw materials by a chemical process (SIC 20); - basic pharmaceutical products and preparations (SIC 21). Manufacture of metallic products covering the manufacture of basic metals (SIC 24) and fabricated metal products (except machinery and equipment) (SIC 25). Manufacture of transport and transport products, covering manufacture of motor vehicles, trailers (SIC 29) and other transport equipment such as ships, boats, rail locomotives and rolling stock, air and spacecrafts (SIC 30).
5 1 The Manufacturing sector is defined by section C within the 2007 Standard Industrial Classification. See for more detail. Manufacturing statistics in Great Britain, 2021 8 Other Manufacturing including manufacture of: - textiles, wearing apparels and leather and related products (SIC 13-15); - tobacco products (SIC 12); - printing and reproduction of recorded media (SIC 18); - computer, electronic and optical products, electrical equipment and other machinery and equipment (SIC 26-28); - repair and installation of machinery and equipment and other Manufacturing (SIC 32-33). The Manufacturing sector is a major employer accounting for around 8% of the GB workforce2. Important Note: The coronavirus (COVID-19) pandemic and the government s response has impacted recent trends in health and safety statistics published by HSE. The coronavirus pandemic has also affected certain data collections and consequently, no new data on working days lost and economic costs is available in 2020/21.
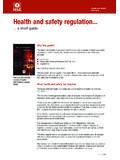
6 More details can be found in our technical report on the impact of the coronavirus pandemic on health and safety statistics . 2 Annual Population Survey, 2020. Many transport and warehousing workers will be employed directly in other industry sectors, and therefore their activities are not included in this report Manufacturing statistics in Great Britain, 2021 9 Work-related ill health All illness In Manufacturing : There were an estimated 88,000 work-related ill health cases annually (new or long-standing). 43% were musculoskeletal disorders, 41% were stress, depression or anxiety. In the recent years prior to the coronavirus pandemic, the rate of self-reported work-related ill health had been broadly flat. In 2020/21 the rate was not statistically significantly different to the 2018/19 pre-coronavirus level. Source: LFS, estimated annual average 2018/19-2020/21 Comparing ill health rates of sub-sectors in Manufacturing : Around of workers in Manufacturing suffered from work-related ill health (new or long-standing cases).
7 This rate is statistically significantly lower than that for workers across all industries ( ). Source: LFS, annual average (2016/17-2020/21). A five-year period has been used to improve the reliability of the sub-sector estimates. The grouped sub sectors are defined in the introduction of this publication. 95% confidence intervals are shown on the chart. Manufacturing statistics in Great Britain, 2021 10 Musculoskeletal disorders In Manufacturing : There were an estimated 38,000 work-related cases of musculoskeletal disorders annually (new or long-standing), 43% of all ill health in this sector. In the recent years prior to the coronavirus pandemic, the rate of self-reported work-related musculoskeletal disorders had been broadly flat. In 2020/21 the rate was not statistically significantly different to the 2018/19 pre-coronavirus level. Source: LFS, estimated annual average 2018/19-2020/21 Comparing rate of musculoskeletal disorders Manufacturing : Around of workers in Manufacturing suffered from work-related musculoskeletal disorders (new or long-standing cases).
8 This rate is not statistically different than that for workers across all industries ( ). Source: LFS, annual average (2016/17-2020/21). A five-year period is used to improve the reliability of the sub-sector estimates. The grouped sub sectors are defined in the introduction of this publication. 95% confidence intervals are shown on the chart. Manufacturing statistics in Great Britain, 2021 11 Stress, depression or anxiety In Manufacturing : There were an estimated 36,000 work-related cases of stress, depression or anxiety annually (new or long-standing), 41% of all ill health in this sector. Prior to the coronavirus pandemic the rate of self-reported work-related stress, depression or anxiety showed no clear trend. In 2020/21 the rate was not statistically significantly different to the 2018/19 pre-coronavirus level. Source: LFS, estimated annual average 2018/19-2020/21 Comparing rate of stress, depression or anxiety in Manufacturing : Around of workers in Manufacturing suffered from work-related stress, depression or anxiety (new or long-standing cases).
9 This rate is statistically significantly lower than that for workers across all industries ( ). Source: LFS, annual average (2016/17-2020/21). A five-year period is used to improve the reliability of the sub-sector estimates. The grouped sub sectors are defined in the introduction of this publication. 95% confidence intervals are shown on the chart. Manufacturing statistics in Great Britain, 2021 12 Changes over time All work-related ill health (new and long-standing cases) In the recent years prior to the coronavirus pandemic, the rate of self-reported work-related ill health had been broadly flat. In 2020/21 the rate was not statistically significantly different to the 2018/19 pre-coronavirus level. No ill health data was collected in 2002/03 and 2012/13, represented by the dashed line Shaded area represents a 95% confidence interval Source: LFS, annual rates Manufacturing statistics in Great Britain, 2021 13 Work-related musculoskeletal disorders (new and long-standing cases) In the recent years prior to the coronavirus pandemic, the rate of self-reported work-related musculoskeletal disorders had been broadly flat.
10 In 2020/21 the rate was not statistically significantly different to the 2018/19 pre-coronavirus level. No ill health data was collected in 2002/03 and 2012/13, represented by the dashed line Shaded area represents a 95% confidence interval Source: LFS, annual rates Manufacturing statistics in Great Britain, 2021 14 Work-related stress, depression or anxiety (new and long-standing cases) Prior to the coronavirus pandemic the rate of self-reported work-related stress, depression or anxiety showed no clear trend. In 2020/21 the rate was not statistically significantly different to the 2018/19 pre-coronavirus level. No ill health data was collected in 2002/03 and 2012/13, represented by the dashed line Shaded area represents a 95% confidence interval Source: LFS, annual rates Manufacturing statistics in Great Britain, 2021 15 Lung disorders Manufacturing compared with the All industries rate Annually around 4,000 workers were suffering with breathing or lung problems caused or made worse by their work (new and long-standing cases).