Transcription of March 2022 PPI Detailed Report - Bureau of Labor Statistics
1 PPI Detailed Bureau of Labor Statistics Mining Manufacturing ServicesAgriculture Utilities ConstructionBLSData for June Department of Labor PPI Detailed Report Data for June 2021 Editors Vol. 25, No. 6 Joseph Kowal Serah Hyde Gabriel Vera Timothy Schermerhorn Contents Page Producer Price Indexes, June 2021 .. 1 Resampling of Industries.
2 6 Addition of Historical Data to Nondurable Goods Wholesale Trade Producer Price Indexes .. 7 Charts Final demand .. 8 Processed goods for intermediate demand .. 9 Unprocessed goods for intermediate demand .. 10 Services for intermediate demand .. 11 Tables Producer Price Indexes 1. Final demand .. 12 2. Intermediate demand by commodity type .. 14 3. Intermediate demand by production flow .. 16 4. Selected commodity groupings by final demand category .. 19 5. Selected commodity groupings of intermediate demand by commodity type .. 22 6. Selected commodity groupings of intermediate demand by production flow.
3 25 7. Selected final demand and intermediate demand categories, seasonally adjusted .. 29 8. Selected commodity groupings .. 30 9. Commodity and service groupings and individual items .. 31 10. Net output of selected industries and industry groups .. 88 11. Net output of selected industries and their products .. 90 12. Special commodity groupings .. 163 13. Net inputs to industries, excluding capital investment, Labor , and imports .. 165 14. Industry and industry-classified product indexes recoded, effective June 2021 .. 169 15. New industry and industry-classified product indexes introduced into the Producer Price Index, effective June 2021 .. 170 16. Industry and industry-classified product indexes deleted from the Producer Price Index, effective June 2021.
4 171 17. Commodity-based product indexes, recoded, effective June 2021 .. 172 18. Commodity-based product indexes introduced into the Producer Price Index, effective June 173 19. Commodity-based product indexes deleted from the Producer Price Index, effective June 2021 .. 174 Technical note .. 175 ii Producer Price Index Release Dates The following is the schedule of release dates for Producer Price Index data for 2021. News releases are issued at 8:30 eastern time on each release date. Reference Month Release Date December 2020 Jan. 15, 2021 January 2021 Feb. 17, 2021 February 2021 Mar. 12, 2021 March 2021 Apr. 9, 2021 April 2021 May 13, 2021 May 2021 Jun. 15, 2021 June 2021 Jul. 14, 2021 July 2021 Aug. 12 2021 August 2021 Sep. 10, 2021 September 2021 Oct. 14, 2021 October 2021 Nov.
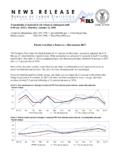
5 9, 2021 November 2021 Dec. 14, 2021 1 _____ Producer Price Indexes June 2021 he Producer Price Index for final demand increased percent in June, seasonally adjusted. Final demand prices rose percent in May and percent in April. (See table A.) On an unadjusted basis, the final demand index moved up percent for the 12 months ended in June, the largest advance since 12-month data were first calculated in November 2010. Nearly 60 percent of the June advance in the final demand index can be traced to a increase in prices for final demand services. The index for final demand goods moved up percent. Prices for final demand less foods, energy, and trade services rose percent in June following an increase of percent in May. For the 12 months ended in June, the index for final demand less foods, energy, and trade services moved up percent, the largest advance since 12-month data were first calculated in August 2014.
6 Final demand Final demand services: Prices for final demand services rose percent in June, the sixth consecutive advance. Seventy percent of the broad-based increase in June is attributable to margins for final demand trade services, which moved up percent. (Trade indexes measure changes in margins received by wholesalers and retailers.) The indexes for final demand services less trade, transportation, and warehousing and for final demand transportation and warehousing services rose percent and percent, respectively. Product detail: Twenty percent of the June increase in the index for final demand services can be traced to margins for automobiles and automobile parts retailing, which rose percent. The indexes for machinery and vehicle wholesaling; hardware, building materials, and supplies retailing; guestroom rental; professional and commercial equipment wholesaling; and transportation of passengers (partial) also moved higher.
7 Conversely, margins for apparel wholesaling fell percent. The indexes for machinery and equipment parts and supplies wholesaling and for gaming receipts (partial) also declined. (See table 4.) Final demand goods: Prices for final demand goods increased percent in June after rising percent in May. Nearly 60 percent of the broad-based advance in June can be traced to the index for final demand goods less foods and energy, which moved up percent. Prices for final demand energy and for final demand foods rose percent and percent, respectively. Product detail: Within the index for final demand goods in June, prices for industrial chemicals rose percent. Prices for gasoline, meats, electric power, processed poultry, and motor vehicles also moved higher. In contrast, the index for oilseeds fell percent.
8 Prices for diesel fuel and for distilled and bottled liquor (excluding brandy) also declined. Intermediate demand by Commodity Type Within intermediate demand in June, prices for processed goods rose percent, the index for unprocessed goods increased percent, and prices for services advanced percent. (See tables B and C.) Processed goods for intermediate demand : The index for processed goods for intermediate demand moved up percent in June following a rise in May. Leading the broad-based increase in June, prices for processed materials less foods and energy advanced percent. The indexes for processed foods and feeds and for processed energy goods moved up percent and percent, respectively. For the 12 months ended in June, prices for processed goods for intermediate demand jumped percent, the largest increase since rising percent for the 12 months ended in February 1975.
9 Product detail: Nearly one-fifth of the June advance in the index for processed goods for intermediate demand can be traced to a increase in prices for steel mill products. The indexes for industrial chemicals, electric power, fabricated structural metal products, plastic resins and materials, and meats also moved higher. Conversely, prices for natural gas to electric utilities dropped percent. The indexes for primary nonferrous metals and for natural, processed, and imitation cheese also decreased. (See table 5.) Unprocessed goods for intermediate demand : Prices for unprocessed goods for intermediate demand rose percent in June following an increase in May. Eighty percent of the broad-based advance in June can be attributed to the index for unprocessed energy materials, which moved up percent.
10 Prices for unprocessed foodstuffs and feedstuffs and for unprocessed nonfood materials less energy rose percent and percent, respectively. For the 12 months ended in June, the index for unprocessed goods for intermediate demand jumped percent. Product detail: Seventy percent of the June advance in prices for unprocessed goods for intermediate demand can be traced to a jump in the index for crude petroleum. Prices for slaughter cattle, iron and steel, raw milk, slaughter poultry, and natural gas also moved up. In contrast, the index for corn fell percent. Prices for oilseeds and for copper base scrap also decreased. T 2 Chart 1. One-month percent changes in selected PPI final demand price indexes, seasonally adjusted Chart 2. Twelve-month percent changes in selected PPI final demand price indexes, not seasonally adjusted '20 JulyAugSepOctNovDecJanFebMarAprMayJune'2 1 Percent changeFinal demandFinal demand goodsFinal demand '20 JulyAugSepOctNovDecJanFebMarAprMayJune'2 1 Percent changeFinal demandFinal demand goodsFinal demand services3 Services for intermediate demand : The index for services for intermediate demand rose percent in June, the seventh consecutive increase.