Transcription of March 27th Automobile Components: Structure and Prospects ...
1 Overview: The Indian auto industry is expected to be the world s third largest by 2016 only behind China and the US and will account for more than 5% of the global vehicle sales as per IBEF. It is also expected to become the fourth largest automobiles producer globally by 2020 after China, US and Japan (India is currently world s second largest two-wheeler manufacturer). The Indian auto components industry is ancillary to the Automobile industry.
2 Demand swings in any of the auto segments (Commercial vehicles, cars, two-wheelers) have an impact on the auto ancillary demand. Indian Auto Component Industry is transforming itself from a low-volume, highly fragmented one into a competitive industry backed by strengths like technology, efficiency and evolving value chain. The industry mainly caters to 2 segments (1) Original Equipment manufacturers (OEM) and (2) Replacement market (Aftermarket). OEM dominates the auto component market contributing around 80 per cent while the replacement market share is around 20 per cent.
3 The auto component sector is largely unorganized with about 10,000 players operating in the unorganized market. There are about 700 players in the organized market as of 2015. The demand from replacement market is low, owing to the high cost of genuine component parts. Unorganized players mainly dominated the replacement market, which were mostly Tier 3/4 component manufacturers. However, in terms of turnover, organized market holds about 85% share. The Indian auto component industry is a highly fragmented industry and was estimated to be valued at around trillion (USD 39 billion) in FY16.
4 This industry has witnessed growth of on y-o-y basis and contributes to to India s Gross Domestic Product (GDP). The industry is in a stage of transformation and the entry of new players in last few years has led to surge in the auto component industry. March 27th, 2017 I Industry Research Automobile Components: Structure and Prospects Contact: Madan Sabnavis Chief Economist 91-22-67543489 Darshini Kansara Research Analyst 91-22-67543679 Mradul Mishra (Media Contact) 91-22-67543515 Disclaimer: This report is prepared by Credit Analysis & Research Limited [CARE Ratings].
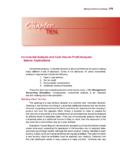
5 CARE Ratings has taken utmost care to ensure accuracy and objectivity while developing this report based on information available in public domain. However, neither the accuracy nor completeness of information contained in this report is guaranteed. CARE Ratings is not responsible for any errors or omissions in analysis/inferences/views or for results obtained from the use of information contained in this report and especially states that CARE (including all divisions) has no financial liability whatsoever to the user of this report Industry Research I Automobile Industry Update 2 Automotive Component in India is split under various segments as follows: Chart 1: Auto Component Segment Source: ACMA Automobiles production Chart 2: Category wise Production of Automobiles (000 units) Source.
6 SIAM Engine PartsPistons and Piston ringsEngine valves and partsFuel-injection systems and carburettorsCooling systems and partsPower train componentsDriveTransmission &Steering PartsGearsWheelsSteering systemsAxlesClutchesBody & ChassisSuspension &Braking PartsBrake and brake assembliesBreak liningsShock absorbersLeaf springsEquipmentsHeadlightsHalogen bulbsWiper motorsDashboard instrumentsOther panel instrumentsElectrical PartsStarter motorsSpark plugsElectric ignition systems (EIS)Flywheel magnetosOther equipmentsOthersSheet matal partsHydraulic pneumatic instrumentsFan beltsPressure die castingsAutoComponents 2,983 3,146 3,231 3,088 3,221 3,414 3,102 761 929 833 699 698 783 654 800 879 840 830 949 934 676 13,349 15,428 15,744 16,883 18,489 18,830 16,651 - 2,000 4,000 6,000 8,000 10,000 12,000 14,000 16,000 18,000 20,0002010-112011-122012-132013-142014-1 52015-162016-17 (Apr-Jan)
7 Passenger VehiclesCommercial VehilesThree-wheelersTwo-wheelers Industry Research I Automobile Industry Update 3 Segment wise domestic market share of Automobile industry Table 1: Segment wise domestic market share (2015-16) % Two-wheelers 79 Passenger Vehicles 14 Three-wheelers 4 Commercial Vehicles 3 Source: SIAM In 2015-16, India s annual production stood at 23,960,940 vehicles (including passenger vehicles, commercial vehicles, three wheelers, two wheelers and quadricycle) as against 23,358,047 in 2014-15, registering a sluggish growth of y-o-y. Two-wheelers have dominated the production volumes of the Automobile industry over the years.
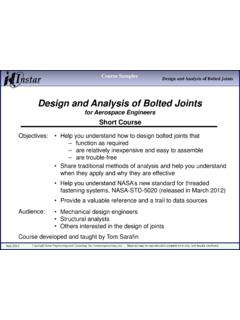
8 Over the past 4 years, two-wheeler production share in the overall Automobile production has remained stable at around 80%. This is followed by passenger vehicles having a share of 14%. Productions of commercial vehicles and three-wheelers have about 3% share each in the Automobile industry. Passenger vehicles comprising 14% in the overall Automobile production in 2015-16, accounts for about 45% of the total auto component production volumes, followed by two-wheelers segment which accounts for about 22% share of the total auto component production volumes. Auto component consumption by OEM Chart 3: Consumption by OEM (%) Source: ACMA PV, 45 Two wheelers, 22 Tractors, 8 HCV, 8 MCV, 5 LCV, 4 Three wheelers, 4 Backhoe Loaders, 2 SCV, 1 Others, 2 Industry Research I Automobile Industry Update 4 Auto Component Aggregate Turnover Chart 5: Aggregate turnover (Rs Billion) Note: The aggregate turnover includes the domestic supplies to OEMs, aftermarket sales and exports for the period Source.
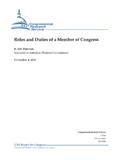
9 ACMA It can be seen from the chart that after marginally declining in 2013-14 the auto components turnover increased by over 11% in 2014-15 on the back of a pick-up in demand from the Automobile industry. The turnover increased, however, at a slower pace in 2015-16. Automobile production increased only marginally by in 2015-16 leading to slower y-o-y auto comp turnover increase of in 2015-16. Export destinations Top 10 countries (2015-16) Chart 6: Country wise Exports Top 10 countries (Per cent) Source: ACMA The size of Indian exports of auto components stood approximate at Rs 709 billion (USD billion) in FY16 and has increased at a CAGR of about per cent from Rs 303 billion (USD billion) in FY11.
10 Exports share in turnover increased from 16% in 2010-11 to 28% in 2015-16 in value terms registering a CAGR of during the period. 1,883 2,046 2,160 2,117 2,348 2,556 1,580 1,619 1,633 1,502 1,663 1,847 303 427 527 615 685 709 - 500 1,000 1,500 2,000 2,500 3,0002010-112011-122012-132013-142014-15 2015-16 Aggregate TurnoverDomestic TurnoverExports Turnover24 7 6 5 4 3 3 3 3 3 USAG ermanyTurkeyUKItalyThailandUAEF ranceBrazilMexico Industry Research I Automobile Industry Update 5 Currently industry exports to more than 160 countries. Key auto components exported from India include gear boxes and parts, hydraulic power steering systems and steering gear systems and parts, parts of diesel engines, drive-axles and parts, suspension systems and parts, brakes and servo-brakes, spark ignition and parts, among others.