Transcription of Margin of Error and Confidence Levels Made Simple
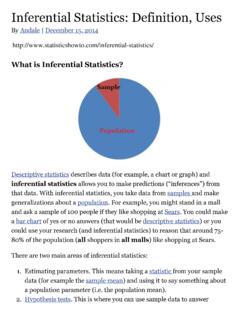
1 Margin of Error and Confidence LevelsMade SimplePamela Hunter A survey is a valuable assessment tool in which a sample is selected andinformation from the sample can then be generalized to a larger has been likened to taste-testing soup a few spoonfuls tell whatthe whole pot tastes key to the validity of any survey is randomness. Just as the soup must bestirred in order for the few spoonfuls to represent the whole pot, whensampling a population, the group must be stirred before respondents areselected. It is critical that respondents be chosen randomly so that the surveyresults can be generalized to the whole well the sample represents the population is gauged by two importantstatistics the survey s Margin of Error and Confidence level.
2 They tell us howwell the spoonfuls represent the entire pot. For example, a survey may have amargin of Error of plus or minus 3 percent at a 95 percent level of terms simply mean that if the survey were conducted 100 times, the data from the population would be within a certain number of percentage points above or below the data found in 95 of the 100 surveys from the other words, Company X surveys customers and finds that 50 percent ofthe respondents say its customer service is very good. The Confidence levelis cited as 95 percent plus or minus 3 percent. This information means that ifthe survey were conducted 100 times, the percentage who say service is verygood will range between 47 and 53 percent most (95 percent) of the ErrorPercent*2,00021,50031,0003900380037 00460045004400530062007100105014*Assumes a 95% levelof confidenceSample Size and the Margin of ErrorMargin of Error the plus or minus 3 percentage points in the above example decreases as the sample size increases, but only to a point.
3 A very smallsample, such as 50 respondents, has about a 14 percent Margin of Error whilea sample of 1,000 has a Margin of Error of 3 percent. The size of thepopulation (the group being surveyed) does not matter. (This statementassumes that the population is larger than the sample.) There are, however,diminishing returns. By doubling the sample to 2,000, the Margin of erroronly decreases from plus or minus 3 percent to plus or minus 2 a 95 percent level of Confidence is an industry standard, a 90percent level may suffice in some instances. A 90 percent level can beobtained with a smaller sample, which usually translates into a less expensivesurvey. To obtain a 3 percent Margin of Error at a 90 percent level ofconfidence requires a sample size of about 750.
4 For a 95 percent level ofconfidence, the sample size would be about 1, the Margin of Error at various Levels of Confidence is the statistical calculation is relatively Simple the most advancedmath involved is square root Margin of Error can most easily be determinedusing the chart below. A few websites also calculate the sample size needed toobtain a specific Margin of Error . Thus, if the researcher can only tolerate amargin of Error of 3 percent, the calculator will say what the sample sizeshould Margin of Error for Individual QuestionsMargins of Error typically are calculated for surveys overall but also should becalculated again when a subgroup of the sample is considered.
5 Some surveysdo not require every respondent to receive every question, and sometimesonly certain demographic groups are analyzed. If only those who saycustomer service is bad or very bad are asked a follow-up question as towhy, the Margin of Error for that follow-up question will increase because thenumber of respondents is smaller than the overall survey sample. Similarly, ifresults from only female respondents are analyzed, the Margin of Error will behigher, assuming females are a subgroup of the Data Is ImpreciseMargin of Error reveals the imprecision inherent in survey data. Survey dataprovide a range, not a specific number. A researcher surveying customersevery six months to understand whether customer service is improving maysee the percentage of respondents who say it is very good go from 50percent in one period to 47 percent in the next six-month period.
6 Both areaccurate because they fall within the Margin of Error . The decrease is notstatistically significant. On the other hand, if those percentages go from 50percent to 54 percent, the conclusion is that there is an increase in those whosay service is very good albeit a small Dark Side of Confidence LevelsA 95 percent level of Confidence means that 5 percent of the surveys will beoff the wall with numbers that do not make much sense. Therefore, if 100surveys are conducted using the same customer service question, five of themwill provide results that are somewhat wacky. Normally researchers do notworry about this 5 percent because they are not repeating the same questionover and over so the odds are that they will obtain results among the 95percent.
7 However, if the same question is asked repeatedly such as a trackingstudy, then researchers should beware that unexpected numbers that seemway out of line may come up. For example, customers are asked the samequestion about customer service every week over a period of months, and very good is selected each time by 50 percent, then 54 percent, 52 percent,49 percent, 50 percent, and so on. If 20 percent surfaces in another periodand a 48 percent follows in the next period, it is probably safe to assume the20 percent is part of the wacky 5 percent, assuming proper methodology isfollowed.