Transcription of Market Segmentation Using Kmeans - Rowe Quality
1 Market Segmentation Using K-Means Cluster Analysis Harry B. Rowe March 26, 2012 Market Segmentation Using K-means Cluster Analysis 2012, Harry B. Rowe 2 A Market segment refers to a group of potential buyers for a category of product or service whose needs are similar. A member of a Market segment has needs that are more similar to the needs of another member of the same segment than to the needs of a member of a different Market segment. An example of Market segments for cars might be luxury car buyers , performance car buyers , and economy car buyers . Clearly, knowledge of Market segments allows producers to target their offerings exactly for the members of specific segments, resulting in higher sales and greater customer satisfaction.
2 The problem for organizations trying to understand the needs of their customers is that they do not know in advance how many Market segments there are, and how the needs of those segments differ from one another. Although some Market segments may align with specific demographic groups (luxury buyers tend to come from upper income groups), others may not ( environmentally conscious buyers may come from all income groups). K-means cluster analysis is a technique for taking a mass of raw data and dividing it into groups that are more similar within groups than between groups. An explanation of how it works is beyond the scope of this article (and beyond the capability of this author). But software libraries and statistical packages exist which allow k-means analysis to be carried out without full knowledge of its implementation.
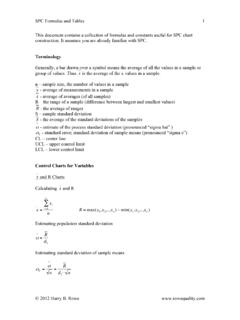
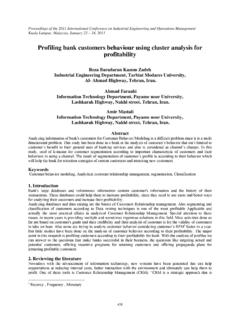
3 The package used for this demonstration is R, an open-source statistical environment available for download from It is available for Windows, Apple Macintosh, and Linux. Figure 1 shows an x-y scatter plot of a data set containing 100 (x,y) pairs. It is easy to see that the data points group into four clusters. Market Segmentation Using K-means Cluster Analysis 2012, Harry B. Rowe 3 Figure 1 While it is easy to see the clusters, it is at best tedious, and at worst impossible, to determine which data values fall into which clusters. It is also tedious to locate the center of the clusters. With R, however, this can be done relatively easily. With the data for the x and y values stored in the (vector) variables x and y, we issue the following commands.
4 (The lines with # are comments and may be omitted.) # # Create a 2-d data matrix # d = cbind( x, y ) # # Find four cluster centers in the data set d, Using the # Hartigan-Wong algorithm, selecting the best fit from # among 10 random starts. # km = Kmeans ( d, centers=4, algorithm="Har", nstart=10 ) # # Print the returned object # print( km ) Market Segmentation Using K-means Cluster Analysis 2012, Harry B. Rowe 4 # The program thinks for a fraction of a second, and returns the following information: K-means clustering with 4 clusters of sizes 25, 25, 25, 25 Cluster means: x y 1 2 3 4 Clustering vector: [1] 1 2 1 2 4 3 2 3 2 2 1 4 1 1 2 3 3 4 4 1 1 3 4 3 3 2 4 2 1 2 1 4 1 3 [35] 4 3 4 1 3 1 2 2 3 4 1 4 4 2 2 3 2 4 1 1 2 2 2 1 4 4 4 1 3 2 3 2 1 4 [69] 3 4 2 4 3 1 3 1 2 3 1 3 2 1 3 3 1 1 2 3 4 3 4 4 3 4 1 4 3 4 2 2 Within cluster sum of squares by cluster: [1] Available components.
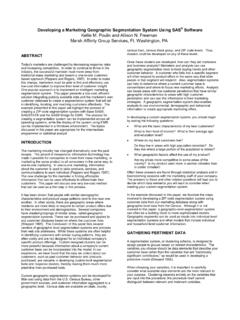
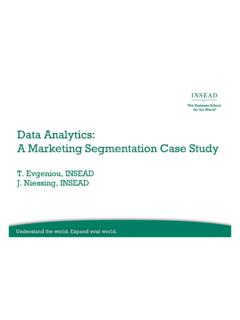
5 [1] "cluster" "centers" "withinss" "size" It is probably obvious that the four Cluster means are the locations of the centers of each of the four clusters. The Clustering vector is a list of numbers corresponding to the rows of the input data, specifying the cluster into which that row was assigned. The Within cluster sum of squares by cluster is a measure of dispersion calculated for each cluster by summing the squares of the distances of each point in a cluster from the center of the cluster. The more points in the cluster, and the more spread out they are, the larger the value will be. These numbers are also called the sum squared errors or SSE . Figure 2 shows the data with the calculated cluster centers plotted in red.
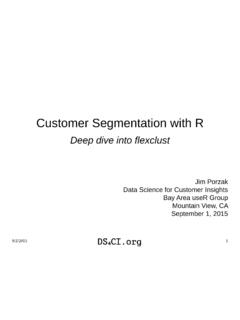
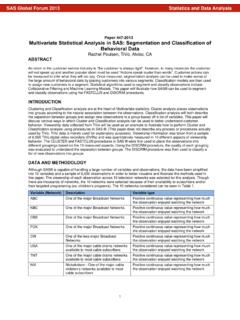
6 As you can see, the calculation does a pretty good job of locating the centers. Market Segmentation Using K-means Cluster Analysis 2012, Harry B. Rowe 5 Figure 2 The algorithm is not limited to two dimensions, however. K-means can be used with data with an arbitrary number of dimensions. To keep the example to something we can easily visualize, we add a z dimension to our dataset and plot the data as in figure 3. Market Segmentation Using K-means Cluster Analysis 2012, Harry B. Rowe 6 Figure 3 In R, we use a very similar set of commands to create and analyze the three-dimensional data set. # # Now add a third dimension # d2 = cbind( x, y, z ) # # # Find four cluster centers for 3-d object # km = Kmeans ( d2, centers=4, algorithm="Har", nstart=10 ) # # Print the returned object # print( km ) # And we get a result in exactly the same form, but with cluster centers in three dimensions.
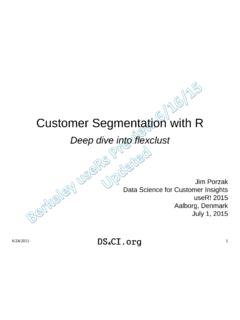
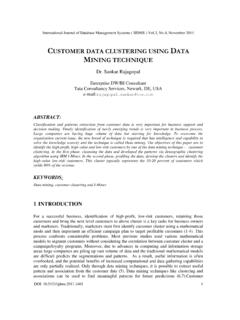
7 K-means clustering with 4 clusters of sizes 25, 25, 25, 25 Cluster means: x y z 1 2 3 4 Clustering vector: [1] 1 2 1 2 4 3 2 3 2 2 1 4 1 1 2 3 3 4 4 1 1 3 4 3 3 2 4 2 1 2 1 4 1 3 [35] 4 3 4 1 3 1 2 2 3 4 1 4 4 2 2 3 2 4 1 1 2 2 2 1 4 4 4 1 3 2 3 2 1 4 [69] 3 4 2 4 3 1 3 1 2 3 1 3 2 1 3 3 1 1 2 3 4 3 4 4 3 4 1 4 3 4 2 2 Within cluster sum of squares by cluster: [1] Available components: [1] "cluster" "centers" "withinss" "size" And the locations of the centers are shown in figure 4. Market Segmentation Using K-means Cluster Analysis 2012, Harry B. Rowe 7 Figure 4 While it is somewhat more difficult, even in three dimensions we can still plot the data in a way that clearly shows the number and general location of the clusters.
8 But what about four, five, or more dimensions? While it is very difficult for humans to visualize data in more than three dimensions, added dimensions present no such difficulty for the k-means algorithm. Simply add the data as additional columns and execute the algorithm. One problem with k-means analysis however is that the user must specify the number of clusters into which to divide the data. What if we don t know how many clusters there are? We usually won t. Figure 5 shows what happens if we ask the k-means algorithm to find three clusters in our 2-D dataset. Market Segmentation Using K-means Cluster Analysis 2012, Harry B. Rowe 8 Figure 5 As you can see, the algorithm obligingly finds three clusters when our eyes easily distinguish four.
9 Fortunately, there is a technique to reduce, but not eliminate, the difficulty. The answer lies in the within cluster sum of squares values reported by the k-means algorithm. If we define an objective function that is the sum of the SSE s over all the clusters in a particular set of n clusters, we can investigate how that function changes with number of clusters. Figure 6 is a plot of this function for our 2-D data for between two and seven clusters. The values on the plot are obtained by executing the k-means algorithm once for two clusters, three clusters, four clusters, and so on. Then the reported SSE values for each is summed and plotted. Market Segmentation Using K-means Cluster Analysis 2012, Harry B.
10 Rowe 9 Figure 6 As you can see, the objective function decreases rapidly up to four clusters, then much more slowly as the number of clusters is increased further. (Theoretically, the SSE will continue to decline until the number of clusters reaches the number of data points.) The abrupt change in slope at four clusters indicates that this is a viable solution for this data set. In practical application, however, there are still difficulties. The k-means algorithm only works if the number of clusters is two or greater. Thus plotting the SSE values allows us to see a sharp change in slope only if the actual number of clusters is three or greater. To illustrate, figure 7 shows a data set with two clusters, while figure 8 shows a data set with no distinct clusters.