Transcription of Market Survey GB Agricultural Land VALUING …
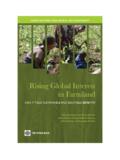
1 Market SurveyGB Agricultural Land2017 Savills World Research UK RuralVALUING BRITAINWe reveal the combined value of GB's million acres of & DEMANDM arket dynamicsGLoBAL AGRIcULTUREA truly international commodityGB farmland is a valuable commodity, so much so that its combined worth in 2016, all million acres of it, has been valued at billion. But what does the future hold? ForewordThE VALUE of GB fARMLANDD espite the extraordinary political developments of the last 12 months and speculation about the economic consequences, last year much of the farmland Market in Great Britain proved incredibly resilient and performed well. Just over 180,000 acres of farmland were publicly marketed across GB during the year. This acreage, despite the uncertainty prior to the EU Referendum, was very similar to the area advertised in 2015, although Market activity was mainly concentrated in the second half of the year notably in overall picture, according to the Savills farmland Value Survey , was of a marginal drop in value year on year (just over 3% in England and GB as a whole), but the results of the sales of a handful of estates each over 1,000 acres, launched in August onwards was very positive with competitive bidding and guide prices well exceeded.
2 The supply and demand profile in 2016 changed very little on previous years although there were a few exceptions including: n the proportion of farmers selling in 2016 was lower than in 2015; with a number of potential factors contributing including a softening in farmland values in the short term, uncertainty surrounding Brexit and the short term prospect of an increase in subsidy as a result of the weak a higher proportion of new non-farmer (lifestyle) buyers those who were purchasing farmland for the first time, although existing lifestyle landowners appeared to have been less competitive in an increased use of borrowed money for farm purchases, 30% of all buyers compared with 23% in 2015, suggesting that buyers Market Survey | GB Agricultural Land02may be taking the opportunity to use cheap money while base rates are at a historical 2017 Agricultural land Market Survey includes some new research we have valued farmland Britain.
3 The combined value of GB's million acres is billion equivalent to 3% of the total value of GB s housing stock, which is worth an investment the current pressure on average farmland values should be set in context against long term performance. The total value of GB farmland and woodland has increased 149% over the past 10 ahead, we anticipate a continuation of the wide variance in results for the best and poorest, with a flight to quality. Barring any major economic or fiscal changes, we do not anticipate significant price rises or falls in the coming years ( overall growth for the next five years) and a return to sustained, steady growth in the longer addition to assets in GB, it is increasingly realistic to hold a diverse portfolio within the global Agricultural sector, offering farmland investors the opportunity to spread risk and maximise returns we look at some opportunities on pages 8 and 9.
4 N Looking ahead, we anticipate a continuation of the wide variance in results for the best and poorest, with a flight to quality Savills Research Alex LawsonDirector020 7409 03 2017 ExEcUTIVE SUMMARYThe combined value of Great Britain's farmland See pages 4/5 Buyer and seller activity in 2016 See pages 6/7 Global agriculture is a truly international commodity See pages 8/9 What is the outlook for farmland and forestry? See pages 10/11 Key Market drivers for 2017 See page growth forecast for farmland over the next five yearsMarket Survey | GB Agricultural Land04GB FarmlandVALUINGBRITAIN The total value of GB farmland and woodland has increased 149% over the past 10 years Savills Researchour research team has for the first time put a value on all of Great Britain s farmland and woodland. The combined value of Britain s million acres is billion which is the equivalent to 3% of the total value of GB s housing stock which is worth a staggering analysis of the value of the total value of farmland takes into account land grades and use and includes a discount to vacant possession for tenanted farmland .
5 The total value of GB farmland and woodland has increased 149% over the past 10 remains a safe and secure investment over the long term, whose performance is counter cyclical to residential property over the long term. It is different from many other assets in that it is tangible; you can live on it, play on it, bring up your family on it and it also offers a range of income generation opportunities. nFIGURE 1 VALUING Britain: total value and 10-year growth of GB farmland typesSource: Savills Research oWNER occUPIED farmland 10-yr growthTRADITIoNAL TENANcIES 10-yr growthMARkET RENT TENANcIES growthWooDLAND 10-yr growthALL GB farmland 05 Source: Defra, Scottish & Welsh Governments, natural England (ALC), The Macaulay land Use Research Institute (LCA) and Savills Research FIGURE 2 Total value of Agricultural land and woodland in 2016 (adjusted for tenure discounts) Total 2016 Value GREAT BRITAIN Total Area (acres) 1-year % change 10-year % change 149% of ENGLANDT otal Area (acres) 1-year % change % change 177%WEST MIDLANDST otal Area (acres) % change % change 215%SoUTh EAST ENGLAND Total Area (acres) 1-year % change % change 210%SoUTh WEST ENGLAND Total Area (acres) 1-year % change % change 153%WALEST otal Area (acres) % change % change 131%NoRTh of ENGLANDT otal Area (acres) % change % change 134%EAST MIDLANDST otal Area (acres) 1-year % change % change 188%ScoTLANDT otal Area (acres)
6 % change % change 89% VALUING BRITAINENGLAND Total 2016 Value Area (acres) % change % change 171% Survey | GB Agricultural Land06 Market dynamicsSUPPLY AND DEMANDD espite Market uncertainty, 2016 witnessed a similar set of results to the previous yearJ ust over 180,000 acres of farmland were publicly marketed across Great Britain during 2016. This, despite the uncertainty prior to Brexit, was very similar to the area advertised in 2015. Over the full year we recorded a similar pattern across England (121,500 acres) and Scotland (44,500 acres), Wales (14,400 acres) being the exception, where supply increased almost 20% but off a smaller historic total area. However, there were differences in activity throughout the year and between countries as illustrated in Figure 3 below.
7 Historic trends suggest that uncertainty creates a lull in Market activity and 2016 s Market dynamics showed some interesting trends. Words: Ian BaileyAt the end of the first half of 2016:n In England, activity tempered by uncertainty and down -6%n In Scotland, the opposite, a degree of referendum fatigue may have helped increase activity (+8%)n Wales showed a similar pattern to Scotland, where activity (albeit from a smaller base where a few farms can distort either way) was up 35%.But in the second half of the year:n In England, activity took off and resulted in an 18% increase on the same period of 2015n In Scotland, conversely, the flurry of activity in the first half of the year ceased and second half activity fell -18%n Wales showed a similar pattern to Scotland, where activity fell -7%.Total 2016 activity across the English regions generally followed the national pattern, with variations on the previous year limited to plus or minus 10% a pattern not often recorded.
8 Our analysis of farm transactions across GB, where Savills acted for the buyer or seller, continues to show the range of motives amongst buyer and seller remains diverse. FIGURE 3 Monthly supply of publicly marketed farmland Source: Savills Research30,00025,00020,00015,00010,0005, 0000 AcresJanFebMarAprMayJunJulAugSepOctnovDe c14,00012,00010,0008,0006,0004,0002,0000 AcresJanFebMarAprMayJunJulAugSepOctnovDe c3,0002,5002,0001,5001,0005000 AcresJanFebMarAprMayJunJulAugSepOctnovDe cENGLANDScoTLANDWALESn 2014 n 2015 n 2016 2016 was a year of two halves Savills 07 Buyers2016 recorded no significant change on previous years in terms of buyer profile with the exception of a higher proportion of new non-farmer (lifestyle) buyers those who are purchasing farmland for the first time, although existing lifestyle landowners appeared to have little appetite to add to their holdings.
9 We believe interest from non-farmers (lifestyle buyers) as the economy picks up may well rise, but our records show that their activity is still significantly below the levels pre Global Financial Crisis (GFC).Figure 4 shows expansion remains the most significant reason (48%) to purchase farmland and over 80% of farmer buyers are expanding; similar to figures recorded in previous and buying for investment, are cited by 25% and 18% of buyers respectively. The weak pound has not yet led to a return of overseas buyers in the numbers seen pre the GFC, when 20% of the Market came from abroad, but enquiry numbers have increased and it may be deals take place in 2017. Our analysis of the principal sources of funds used to buy farmland shows there has been an increased use of borrowed money for farm purchases, 30% of all buyers compared with 23% in 2015, suggesting buyers may be taking the opportunity to use cheap money while base rates are at a historical proportion of buyers (7%) using rollover as the principal source of funds was similar to 2015 and is still a long way off levels pre the GFC of over 25%.
10 We expect this source to become more significant as housebuilding increases following improvement in the development sector and government incentives. Sellers The proportion of farmers selling in 2016 was lower than in 2015; with a number of potential factors contributing including a softening in farmland values in the short term, uncertainty surrounding Brexit and the short term prospect of an increase in subsidy as a result of the weak reduction is balanced by an increased proportion of non-farmer and institutional/corporate sellers. These do not have the same sentimental attachment and tend to sell more regularly as circumstances 5 shows the proportion of sellers citing debt related reasons as the main reason to sell is similar to 2015 but an increasing proportion are selling to retire a significant 28% in 2016. However, digging deeper into the data shows over 40% of farmers cite retirement as a reason for selling and an additional 20% for debt related reasons.