Transcription of Massachusetts Department of Correction
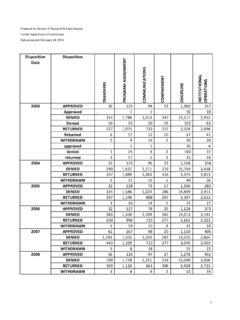
1 Massachusetts Department of Correction 2012 Annual Grievance Report Summary The 2012 Annual Grievance Report provides detailed statistics and specific departmental and institution trends and issues. The following briefly highlights some of the more notable issues that occurred for the year. Performance Measure: Increase approval/partial approval of legitimate grievances The goals for the grievance process was to continue to implement and maintain the systemic changes that began with the implementation of reform measures in 2004 to ensure the integrity and fairness of the grievance process. The success of the system is determined, in part, by specific outcomes relative to the performance measure of increasing the approval/partial approval rate from 2003 baseline of 9%.
2 This performance measure has consistently been met since that time as the rate has remained in the 20% -32% range. The intended results were again achieved in 2012 with an approval/partial approval rate of 32%. Much credit is to be given to Superintendents and Institution Grievance Coordinators for continuing their efforts in achieving these results and proving that objective investigations can be done with accurate and fair outcomes. Institution Operations Another goal for the year was to continue to expand use of the grievance statistics to assess trends and problem areas and take action to improve policies, procedures, and practices. This year was successful in this regard as institutions report a number of operational changes that were made as a result of continuous review of grievances and statistics.
3 This is a positive indicator that the data is not just being collected, but rather being utilized proactively to assess trends and improve facility operations and procedures. The informal complaint resolution process has also contributed to the positive change throughout the agency. Property data has been utilized to improve the future property policy and newly developed standard operating procedures. Additional Grievance Statistics Total Grievances Filed: In terms of the overall number of grievances filed, there was a 10% increase in grievances departmentally from 5707 in 2011 to 6274 in 2012. This year there was a notable increase even with the Informal Complaint Resolution Process in operation.
4 However, the informal process is not yet mandated for inmates as a first step prior to filing a grievance. Additionally, this year there was an overall notable increase in the total number of informal complaints filed. In 2011, 1551 * All non-grievable issues were removed from the 2011 data indicated in this report. informal complaints were filed and in 2012 there were 1823 informal complaints filed. There were reductions in the overall number of grievances filed at 4 institutions to include Souza Baranowski Correctional Center, Old Colony Correctional Center, Northeastern Correctional Center and Boston Pre-Release. The remaining 14 Institutions recognized increases. The most significant increase was noted at MCI-Concord who recognized a 120% increase.
5 In 2011, MCI-Concord had 279 grievances filed however this number jumped to 615 in 2012. The Massachusetts Treatment Center also recognized a 112% increase in grievance numbers climbing from 221 in 2011 to 469 in 2012. Additionally, the Massachusetts Alcohol and Substance Abuse Center had a 160% increase with the number of grievances filed. In 2011 there were 10 grievances filed however this number increased to 26 in 2012. Additionally, it is noted that the female institutions recognized an overall 86% increase in the number of grievances filed in 2012 (360) compared to 2011 (194). Individually, MCI-Framingham had a 49% increase in the number of grievances filed in 2012 (219) compared to 2011 (147).
6 South Middlesex Correctional Center had a 57% increase in grievances filed in 2012 (74) compared to 2011 (47). Very notable is that the agency recognized a 23% increase in staff misconduct arievances reauirina formal intakes via i:he ini:ernai Affairs Unit. The totai iiied .. " ------increased reflect 119 grievances filed in 2011 to 146 grievances fi!ed in 2012. The increase was most notable in medium and minimum security with medium security numbers increasing from 31 in 2011 to 85 in 2012 for a 174% increase overall. Minimum security numbers increased from 2 in 2011 to 10 in 2012. Maximum security realized a 41% decrease when their numbers dropped from 86 in 2011 to 51 in 2012.
7 Overall this increase indicated that more staff allegations were formally investigated when compared to the previous year. Emergency Grievances: The number of emergency grievances has increased by 93% with 30 emergency grievances filed in 2011 to 58 being filed in 2012. In the previous three years the numbers were steadily declining. Informal Resolution In 2012 the agency continued to see the benefits associated with the informal complaint resolution process. If the informal process did not exist the agency potentially may have recognized a more significant increase in the total number of grievances filed in 2012. The Office of Administrative Resolution will continue to focus on this in the year ahead and will work with facilities to improve effectiveness of the informal complaint resolution process.
8 Once mandated by policy there should be a notable change. 2 * All non-grievable issues were removed from the 2011 data indicated in this report. Grievance Type Trends In order to identify a wide range of institution and agency operational and climate issues, the Department tracks approximately 62 categories of grievances. The following reflects the trends relative to the ten most grieved issues in 2012. 1. Property (1657) As is the case each year, property was the most grieved issue and comprised 26% of the total grievances filed. More than half of those complaints came from SBCC (536), MCI-Norfolk (237), MCI-Cedar Junction (217), OCCC (165), and MCI-Shirley (157). It is notable that overall property increased 5% departmentally from 2011 to 2012.
9 Monetary settlements related to property grievances amounted to approximately $4,288. This represents an increase from the 2011 monetary settlements of $3,894. A substantial portion of the total settlement costs in 2012 were from OCCC ($754), MCI-Shirley ($734) and NCCI ($530). Overall, the high number of property grievances are attributed to operational and policy inefficiencies and/or poor adherence to Inmate Management System (IMS) and policy requirements. This is an area that clearly needs departmental and systemic improvements. A new Property Policy and Standard Operating Procedures has been developed to help improve this area of operation however it must go through the public hearing process.
10 It is noted that 40% of the property grievances filed relate to the internal transfer/handling of inmate property. 2. Other-Staff (555) The majority of Other-Staff grievances (359) were filed in medium security. However, a review of individual institutions showed that MCI-Cedar Junction had the highest number of Other-Staff grievances (93) followed by SBCC with (82). It should be noted that due to changes in reviewing staff misconduct allegations some matters viewed as supervisory issues were added to this category but not all were being handled as inquiries as required by policy. Other-Staff grievances should continue to be monitored to ensure all "staff -other" grievances are being reviewed and referred appropriately for an institution inquiry in accordance with the 522 policy.
