Transcription of Math 17: Intro Stats Final Exam - amherst.edu
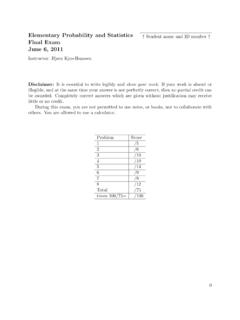
1 Name:_____ Math 17: Intro Stats Final Exam December 19, 2010 Directions: Before you leave, you must turn in both this exam sheet and any statistical tables. If not, you will receive a significant grade reduction. You are allowed to use a calculator and a two-sided sheet of notes for this exam. All cell phones, PDAs, iPods, laptops, etc, should be turned off and put out of sight. You may not discuss the exam with anyone but me. In total, this exam is worth 200 points. You have the entire period to complete this exam. Part I Multiple Choice: There is only ONE correct response per question. Each question is worth 5 points. There are a total of 10 questions for a combined total of 50 points.
2 Clearly circle or write your answer in front of each question. Part I Total Score Possible Points 50 Part II Free Response: You must show all work in order to receive full credit. Each question is worth a different amount of points and this value is noted in the table below. There are a total of 8 questions with multiple parts for a combined total of 150 points. Part II 1 2 3 4 5 6 7 8 Total Score Possible Points 12 20 20 18 25 18 12 25 150 Here is my suggestion: Read all questions before beginning and try to complete the ones you know best first. GOOD LUCK!!! 2 PART I: MULTIPLE CHOICE. Choose the one alternative that best completes the statement or answers the question.
3 1. Which of the following variables is a binomial random variable? A) the time it takes a randomly selected student to complete a multiple choice exam B) the number of textbooks a randomly selected student bought this semester C) the number of women taller than 63 inches in a random sample of 10 women D) the number of CDs a randomly selected person owns E) the hair colors found in a random sample of 10 students 2. Which statement is not true about confidence intervals? A) A confidence interval is an interval of values computed from sample data that is likely to include the true population parameter value. B) An approximate formula for a 95% confidence interval is sample estimate margin of error.
4 C) A confidence interval between 20% and 40% means that the population proportion definitely lies between 20% and 40%. D) A 99% confidence interval procedure has a higher probability of producing intervals that will include the population parameter than a 95% confidence interval procedure. E) Confidence intervals are (by definition) statistical inference procedures. 3. True or False: The p-value is the probability that the null hypothesis is true. A) True B) False 4. For which of the following paired variables, as defined, could not be used to calculate a chi-square statistic? A) Resting Heart Rate (beats/min) and Actual Age (yrs) B) Whether or not have a Job and Year in School (Fr, So, Jr, Se) C) Gender and Opinion About Capital Punishment D) Age Group (under 20 yrs, 21-29 yrs, 30-39 yrs, etc) and Favorite Type Of Music E) None of the above 5.
5 A statistics professor wants to know how her students feel about an introductory statistics course and decides to administer a survey to a random sample of students taking the course. If she randomly selects a class rank (freshmen, sophomores, juniors and seniors) and survey every student in that class rank, what sampling method does she use? A) simple random sampling B) stratified random sampling C) cluster sampling D) sampling with replacement E) systematic sampling 3 6. What statement is true about both p and ? A) They are both parameters B) They are both statistics C) They are both symbols pertaining to means D) is a statistic and p is a parameter E) is a parameter and p is a statistic 7.
6 A short quiz has one true/false question and two multiple choice questions with five choices. A student guesses at each question. Assuming the choices are all equally likely, what is the probability that the student gets all three correct (assume independence)? A) 1/3 B) 1/5 C) 1/10 D) 1/25 E) 1/50 8. Suppose you have to cross a train track on your commute to school. The probability that you will have to wait for a train is .2. If you don t have to wait for the train, the commute takes 15 min, but if you have to wait it takes 20 min. What is the correct set-up for the calculation for the expected time it takes to you to commute to school? A) Expected Commute Time = 15(.2) + 20(.8) B) Expected Commute Time = 20(.
7 2) + 15(.8) C) Expected Commute Time = 20(.2) -15(.8) D) Expected Commute Time = 20(15) + (.2)(.8) E) None of the above 9. In a survey, students are asked how many hours they study in a typical week. A five-number summary of the responses is: 2, 9, 14, 20, 60. Which interval describes the number of hours spent studying in a typical week for about 25% of the students sampled? A) 2 to 14 B) 2 to 60 C) 9 to 20 D) 14 to 60 E) 20 to 60 10. Which of the following correlation values indicates the strongest linear relationship between two quantitative variables? A) r = B) r = C) r = D) r = E) r = 4 PART II: FREE RESPONSE. Write the word or phrase that best completes each statement or answers the question.
8 President Marx, in his last year of presidency, would like to know more about students at amherst and has formed a committee of twenty eight to analyze a campus-wise online survey recently done via The sample consists of responses from n = 173 randomly selected students and is believed to be representative of the student body at amherst . The Independence Assumption is satisfied, so do NOT worry about checking the randomization condition and the 10% condition in Q1 Q8. (You DO need to check other conditions when doing inference below.) 1. Three committee members, Andrea, Natasha, and Brian (Safstrom), are particularly interest in the lives of athletes on amherst campus.
9 They notice that among 173 students in the survey, 53 participate in varsity sports. A. Based on the survey results, construct and interpret a 95% confidence interval for the proportion of amherst students who are varsity athletes. B. Explain the meaning of 95% confidence in part A. 5 2. Another three committee members, Christina, Julio-C, and Brian (Smith), also want to know more about amherst athletes. They are curious if there is an association between students ethnicity and whether they are varsity athletes. A. What is the appropriate analysis to perform (be specific) and state appropriate hypotheses. Analysis: Null: Alternative: B.
10 The two-way table below summaries the results from the survey. Observed (Expected) is the table setup. Use the observed counts to answer questions in this part. Ethnicity\ VarsityAthlete YES NO Total African American ( ) 5 ( ) 16 ( ) 21 Asia-Pacific ( ) 3 ( ) 17 ( ) 20 Caucasian 42 ( ) 58 ( ) 100 Hispanic 2 ( ) 17 ( ) 19 Others 1 ( ) 12 ( ) 13 Total 53 120 173 What is the conditional distribution (in %) of ethnicity for varsity athlete students? Caucasian Hispanic Others . For non-varsity-athlete students?

![[Fill-in-the-blank] tests measure and multiple choice ...](/cache/preview/5/e/e/9/b/f/1/7/thumb-5ee9bf17e1539b3a63fea89d05cad259.jpg)
