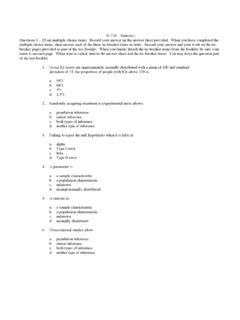
Transcription of MCQS - Statistics course 1 - floppybunny.org
1 Robin beaumont C:\w eb_sites_mine\HIcourseweb new\stats\basics\MCQS_statistics_course1 _student_v Page 1 of 28 mcqs - Statistics course 1 Written by: Robin Beaumont e-mail: Date last updated Wednesday, 03 November 2010 Version: 1 Contents 1. Defining data .. 2 2. Defining the centre .. 3 3. Graphics .. 5 4. Spread .. 8 5. Sample / Populations .. 10 6. Assessing a single mean .. 12 7. Assessing two means .. 15 8. Assessing Ranks .. 17 9. Correlation .. 19 10. Simple regression .. 21 11. Proportions and Chi 23 12. Risk, rates and odds .. 23 13. Survival analysis .. 24 14. Hypotheses, Power and sample size.
2 26 15. Simple logistic regression .. 28 This document lists all the mcqs in Statistics course 1 that may be in the timed online MCQ exam. Robin beaumont C:\w eb_sites_mine\HIcourseweb new\stats\basics\MCQS_statistics_course1 _student_v Page 2 of 28 1. Defining data 1. I suggest two reasons why I feel people fall foul at the first hurdle of learning Statistics . Which of the following are they? (two correct choices) a. 'user friendly' introductions under emphasising basic concepts b. 'user friendly' introductions incorrectly explaining basic concepts c. Statistics presented as a poorly defined subjective discipline d.
3 Over emphasis on the use of computers e. Statistics presented as a clear cut subject with clearly defined rules 2. Which of the following is an example of nominal data? (one correct choice ) a. Number of people on a course b. Cancer staging scale c. List of different species of bird visiting a garden over the past week d. Popularity rating of UK top ten television programmes e. Heart rate 3. Which of the following are examples of Interval/Ratio data? (two correct choices) a. Number of people on a course b. Cancer staging scale c. List of different species of bird visiting a garden over the past week d. Popularity rating of UK top ten television programmes e. Heart rate 4.
4 Which of the following are examples of Ordinal data? (two correct choices) a. Number of people on a course b. Cancer staging scale c. List of different species of bird visiting a garden over the past week d. Popularity rating of UK top ten television programmes e. Heart rate 5. Which of the following is the correct listing of data from the simplest to the most complex? (one correct choice ) a. Nominal -> Ordinal -> Interval -> Transcendental b. Nominal -> Ordinal -> Interval -> Ratio c. Qualitative -> Ordinal -> Interval -> Discrete d. Qualitative -> Ordinal -> Interval -> Ratio e. Nominal -> Ordinal -> Interval -> Quantitative 6. Which of the following is an incorrect statement about Ranking a dataset?
5 (one correct choice ) a. You can rank any dataset as long it is not Nominal b. Each value in a dataset should only occur once c. The process of ranking a dataset involves ordering it and then assigning a 'rank' value to each score from 1 to the number of scores in the dataset. d. When ranking a dataset tied scores receive the average of the rank value given to the ties. e. The result of ranking a dataset means that you loose the effect of magnitude if the data were Interval/Ratio Robin beaumont C:\w eb_sites_mine\HIcourseweb new\stats\basics\MCQS_statistics_course1 _student_v Page 3 of 28 2.
6 Defining the centre 1. What is the main aim of descriptive Statistics (one correct answer)? a. Reduce the number of scores to a smaller more typical dataset b. Create a comparable dataset c. Reduce the number of scores to one value that provides a description of some aspect of the dataset d. Increase the dataset to represent a population e. Provide a narrative interpretation of a dataset 2. Which of the following are measures that attempt to describe the typical score of a dataset (three correct answers)? a. Deviation b. Mode c. Median d. Mean e. Residual f. Range g. Frequency 3. Which of the following provides the best definition of a frequency when the term is applied to a dataset?
7 A. The number of occurrences for a range of values that a variable takes in a data set b. The number of occurrences for zero values that a variable takes in a data set c. The number of occurrences for one, or a range of values that a variable takes in a data set d. The number of occurrences for the mean value that a variable takes in a data set e. The number of occurrences of inappropriate values that a variable takes in a data set 4. Which of the following provides the best definition of the term relative frequency when the term is applied to a dataset? a. The same as the percentage for a particular value a variable may take in a dataset b. The number of occurrences of the mean value that a variable takes in a data set divided by the total number of scores in the dataset c.
8 The number of occurrences for one, or a range of values that a variable takes in a data set divided by the total number of scores in the dataset d. The number of occurrences of negative deviations divided by the total number of scores in the dataset e. The number of occurrences of positive deviations divided by the total number of scores in the dataset 5. For which type of data is the mode the most appropriate descriptive statistic? a. Ordinal b. Interval/ Ratio c. Nominal d. Textual e. Quantitative Robin beaumont C:\w eb_sites_mine\HIcourseweb new\stats\basics\MCQS_statistics_course1 _student_v Page 4 of 28 6.
9 To work out the median by inspecting the scores what must you first do to the dataset? a. Remove any negative values b. Rank c. Work out the mean d. Count the total number of scores e. Know the formula to use 7. What is the main difference between the median and mean? a. The median uses the ranked values whereas the mean uses the frequencies b. The median uses the ranked values whereas the mean uses the actual values c. The mean uses the ranked values whereas the median uses the actual values d. There is no difference e. The median uses deviations whereas the mean uses the actual values 8. When calculating the median for a dataset consisting of an even number of scores ( 2,4,6 etc.)
10 Which of the following is correct? a. Calculate the average value of the three middle ranked scores b. Calculate the mean for the whole dataset which would provide the same answer in this instance c. Calculate the average value of the two middle ranked scores d. Calculate the mode and use instead e. Choose either the upper or lower value of the two 9. Which of the following statements concerning the mean is incorrect (choose one)? a. The mean is not suitable for nominal data b. The mean is sensitive to a single extreme value c. The mean should always be used as the preferred measure to indicate a typical score d. The mean is a more complex descriptive statistic than either the mode or median e.