Transcription of MDM4U Final Project - GABRIELSE FAMILY
1 MDM4U Culminating Date: Page 1 of 5 MDM4U Culminating Research Project This investigation allows you to demonstrate your knowledge and skills from this course by addressing a single problem on statistics and probability. What is it? The culminating Project for this course is a statistical paper on a topic of your choice. It will reflect your understanding of a large portion of the material in this course. It will be an ongoing task that will require much reflection, adaptation and refining in order to complete successfully. The Project will require you to conduct research, collect data, and perform statistical analyses as well as prepare a comprehensive written statistical report and present your findings to the class. The formal analyses concentrates on several topics covered in the course. You will be given some class time throughout the semester to work on the Project , however, you will need to spend time OUTSIDE of class in order to be successful.
2 How is it evaluated? The Final Project will consist of two parts a written report (10%) and a presentation (5%). As part of this Project , you will be required to maintain a process folder that demonstrates various milestones required to complete the Project . Its purpose is to allow for feedback as you progress through the stages required to complete a successful Project . These updates will be marked and will count towards your term mark (above the 15% of the Final product). Process Folder by Sections For each update, you will be given an outline that defines the requirements for the task along with the marking criteria for that update. Below is an overview of the updates which you must include in your process folder. Due dates for the updates are also listed. 1) Topic Selection: Searching for an Area of Interest Due: Sep 22, 2016 a) Begin by thinking of a topic that interests you. Remember that the Project will take a full semester to complete so you should choose a topic that will hold your interest for the entire semester.
3 B) Conduct some secondary research on your topic to get a better idea of all the possible angles from which you could approach your topic. c) Create a mind map to help you explore and refine your ideas. Along with the mind map you create, you are required to submit a topic proposal. The proposal should include three possible areas of interest that stem from your selected topic. You will later choose one of these areas to focus on for the rest of your Project . For each area of interest, you will be required to submit the following: Three to five issues that may be researched regarding the topic 3 5 properly cited and annotated list of resources including websites, journals, articles etc. MDM4U Culminating Date: Page 2 of 5 2) Forming a Thesis Statement Due: Oct 13, 2016 At this stage of the Project you will be required to have thoroughly read through your research and increased your knowledge and understanding of your topic.
4 It is at this point that you will write a thesis statement that will be the basis of your statistical report. You will be required to submit the following: Your chosen area to be studied with a clear statement or a question to be considered (Thesis Statement) , is the Canadian Healthcare system sexist? An brief explanation as to why it is important to investigate this question/topic A list of variables to be examined Background and history as it directly relates to your thesis statement Properly cited and annotated list of resources including websites, journal, articles, etc. that supports your thesis and list of variables. These resources should include but also go above and beyond those previously submitted for this topic. 3) Tables of Data: Part One Due: Oct 31, 2016 The submission for this update will include: Two tables data (ideally cross-sectional data) that could be used for calculations of various types of central tendency and measures of spread.
5 A properly cited resource list for the tables of data. For at least one table of data you must comment on the sampling methods used by the researcher/organization in the collection of data. 4) One-Variable Analysis Student/Teacher Conference Due: Nov 17, 2016 For this update, you will conference with your teacher, showing your progress to-date. You will not be required to submit anything to your teacher but you must be prepared to show/defend your one-variable analyses (electronically), including various measures of central tendency and spread you have investigated. You will be evaluated on the thoroughness of your analyses. You must include the evaluation in your progress folder. 5) Tables of Data: Part Two Due: Dec 1, 2016 At this stage of the Project you will submit the tables of data which you believe will help answer your thesis statement. This submission requires you to consider two or more possible variables that require statistical analysis in order to answer the thesis question.
6 The submission for this update will include: Two tables of time series data that could be used for regression analysis in your Project . A properly cited resource list for the tables of data. For at least one table of data you must comment on the sampling methods used by the researcher/organization in the collection of data. 6) Two-Variable Analysis Student/Teacher Conference Due: Dec 14, 2016 For this update, you will once again conference with your teacher, showing your progress to-date. You will not be required to submit anything to your teacher but you must be prepared to show/defend your two-variable analyses (electronically), including regression analyses for linear correlation as well as the best non-linear regression for the data. You will be evaluated on the thoroughness of your analyses. You must include the evaluation in your progress folder. MDM4U Culminating Date: Page 3 of 5 7) Presentation Dec 20 to Dec 23, 2016 You will be randomly selected to do your presentation any day between the above mentioned dates.
7 You are also required to be present during the other students presentations for peer evaluations. Your presentation must include: An introduction and background information to your topic Thesis statement and the variables being analyzed Final value of calculations and any graphs used in support of a variable. Brief analysis of your graphs, probabilities, and calculations A Final overall conclusion based on the presented data 8) Statistical Report Due: Jan 10, 2017 Your Final report will be due when you return from the winter break. It should follow a proper report format (a sample is provided on the next page). As you write your report keep the following in mind: Keep the body length to a maximum of 10 pages (excluding title page, table of contents, summary, references, and appendices) Use a standard font (Arial, Times New Roman, or Calibri) with font size of 12 Use spacing or double spacing Make sure the content of the report is in a logical order and there are no obvious errors Make sure that all graphs/charts are properly labeled Graphs that are being compared should have the same scale Graphs and diagrams should be sized and positioned appropriately within the text Ensure a proper header is included Proofread!
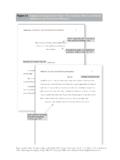
8 Proofread!! Proofread!!! Written Report Format Example Only Your Final report should have the following sections: Title Page Table of Contents Summary - In one page, briefly summarize your entire report (The length of a summary should not exceed 10% of the body of your report). - A summary section is something that would be read by a manager who didn t have enough time to read the entire report, so make sure that you have enough details that it can stand by itself. Introduction - State your idea/hypothesis, where it came from and its significance. - The main thesis question is the theme of your report (Why do teenagers pay so much for car insurance?), - Hypothesis: What you believe will happen. MDM4U Culminating Date: Page 4 of 5 Problem - Problems: The sub questions you will use to solve your main thesis question. These should be specific enough that they contain your variables that you will test. The problems may evolve slightly throughout the life of your Project .
9 (What is the relationship of death rates for various age groups? What is the relationship between collisions and various age groups? What is the relationship between insurance rates and age? What are the probability distributions of collisions with age (by gender) and with drivers killed (by gender) with respect to their age? Plan and Methodology - Explain in detail exactly how you carried out your data collection, what data you collected and what you hoped it would show. Specifically, you should describe how your data will support your hypothesis. You should also highlight any difficulties and problems you had finding the data. Analysis - Describe in detail everything you have done to the data to prove your hypothesis. Include only the most relevant parts of your analysis. Do not include anything that is not worth discussing. Avoid repetitious graphs by choosing a selection that will display the data to best support your comments.)
10 Do not be overly concerned if your hypothesis is not proved; rather try to explain why this may have happened. - Here are examples of analysis tools that you can use: (a) Numerical - Find means, modes, and medians - Find the standard deviations, variances, and IQRs - Use linear regression and find a correlation coefficient - Find probabilities (b) Graphical - Scatter plots - Histograms - Other graphs as necessary (box and whisker, Venn diagrams, probability distributions, etc.) Conclusion - Draw conclusions that directly relate to your thesis. - Note any biases in your study. - Make suggestions for further studies References - All sources of your work must be cited using the APA format. Appendices - Include all large tables and/or charts of analysis that were not appropriate to include in the main body of your report. Label each appropriately and refer to it in the text of the report, if necessary MDM4U Culminating Date: Page 5 of 5 Some websites that maybe useful include: Statistics Canada: Data on population and economy: A sample Project done by 2 pre-service teachers: Power from Data from StatsCan (has stuff on Data Collection): Environment Canada: Transport Canada: US Economic Time Series Data: Some sociological Internet sites: Has link to different websites with data on sociological topics Browse through collections of web pages and articles on different sociological topics plus links to different websites for sociological data.


