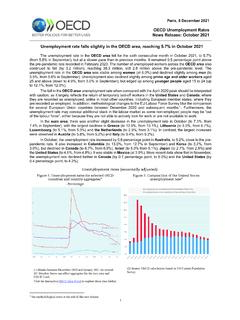
Transcription of Mean age - OECD
1 OECD FAMILY DATABASE, 1 Updated: August 2021 Click here to download the data in Microsoft Excel Format : Age of mothers at childbirth and age-specific fertility Definitions and methodology This indicator contains information on the age of mothers at childbirth and levels of fertility across age groups. It is based on two main measures: Mean age of mothers at birth, calculated as the simple mean average age in years of women at childbirth. The mean age of mothers at birth is shown both for all births and also for first births only. Age-specific fertility rates, calculated as the number of births per 1000 women of a given age in a given year. As a means of simplification, age-specific fertility rates are presented here per five-year age group and with particularly focus on fertility among adolescent (15-19 year old) women. Key findings In most OECD countries, the average age at which women give birth now stands at 30 or above (Chart ).
2 Only in three Latin American OECD countries (Colombia, Costa Rica and Mexico) is the mean age of women at childbirth 28 or less, and in only six (Chile, Hungary, Poland, the Slovak Republic, Turkey and the United States) is it between 28 and 30. In all remaining OECD countries, the average age of women at childbirth is at least 30. In several OECD countries ( Japan, Ireland, Italy, Korea, Luxembourg, Spain and Switzerland), the average age is about or above 32. Most OECD countries have seen the average age of women at childbirth increase by somewhere between 2 and 5 years between 1970 and 2019, with the largest increase ( years) in the Czech Republic. However, three Latin American countries (Colombia, Costa Rica and Mexico) have seen the opposite there, the mean age of women at childbirth has decreased by over two years since 1970. Chart Mean age of women at birth, 1970, 2000 and 2019 or latest available Note: For 2019, data for Chile, Colombia and Costa Rica refer to 2014, for the Russian Federation to 2016; for Israel, Japan, Korea and the United States to 2017; and for Mexico, New Zealand and the United Kingdom to 2018.
3 Sources: for European countries, Eurostat Demographic Statistics; for Australia: AIHW Australia's mothers and babies 2019 data tables; for Canada, Statistics Canada Table 13-10-0417-01 Mean age of mother at time of delivery (live births); for all other countries, United Nations World Fertility data 2019 This document, as well as any data and any map included herein, are without prejudice to the status of or sovereignty over any territory, to the delimitation of international frontiers and boundaries and to the name of any territory, city or area. The statistical data for Israel are supplied by and under the responsibility of the relevant Israeli authorities. The use of such data by the OECD is without prejudice to the status of the Golan Heights, East Jerusalem and Israeli settlements in the West Bank under the terms of international law. Other relevant indicators: Family size and composition ( ); Fertility rates ( ); Share of births outside marriage ( ); and Marriage and divorce rates ( ).
4 22242628303234 Mean age2019 19702000 OECD FAMILY DATABASE, 2 Updated: August 2021 Click here to download the data in Microsoft Excel Format Increases in the mean age of women at childbirth are driven at least in part by a trend towards postponement of the first birth (Chart ). Current mean ages at first birth vary considerably across OECD countries in the United States, for example, the average age at which women give birth to a first child is , whereas in Korea it is as high as All OECD countries with available data have seen the mean age at first birth increase since 2000, with most recording an increase of at least 2 years. In Estonia, Korea and Lithuania, it has risen by around 5 years. Chart Mean age of women at first birth, 2000 and 2019 or latest available Notes: For 2019, data for Canada refer to 2016; for Israel, Japan and Korea to 2017, for the United Kingdom to 2018. Sources: for European countries, Eurostat Demographic Statistics; for Canada, Statistics Canada; for Israel, Central Bureau of Statistics; for Japan, Ministry of Health, Labour and Welfare; for Korea, KOSIS; for the UK, Office for National Statistics; for the United States, Centres for Disease Control and Prevention The shift towards postponement of the first birth is reflected in trends in adolescent fertility rates (Chart ).
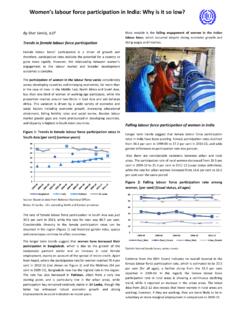
5 On average across OECD countries, current fertility rates for women aged 15-19 stand at births per 1000 women. All OECD countries have seen adolescent fertility fall over the past few decades, sometimes by as much as 50 or more births per 1000 women aged 15-19 ( Austria, Iceland, New Zealand and the United States). However, adolescent fertility rates remain high in some OECD countries. In Costa Rica, for example, the latest adolescent fertility rate is births per 1000 women aged 15-19. In Colombia and Mexico, it is over 70 births per 1000 women aged 15-19 over five times higher than the OECD average. However, the effects of the delay in childbearing are best illustrated by looking at shifts in fertility across age groups. Chart shows, by country, age-specific fertility rates by five-year age groups for the years 1970, 1995 and 2019. In almost all OECD countries, fertility rates among 20-24 year olds and 25-29 year olds are much lower today than they were in 1970.
6 Much of the decline in fertility among women aged 20-29 occurred between 1970 and 1995, but in many countries fertility rates for women in their 20s have continued to fall since 1995. Conversely, current fertility rates for women aged 30-34 and 35-39 in several OECD countries are slightly higher than they were in 1970. In fact, in many countries such as Australia, Denmark, Finland, Germany, New Zealand, Norway and the United Kingdom fertility rates among 30-34 year olds have increased to the point where they are now higher than among any other age group. This is not the case in all OECD countries some, such as Colombia, Costa Rica, Chile, Iceland, Ireland, and Mexico have seen fertility rates decline across almost all age groups. Broadly though, Chart shows that in addition to a general decline in fertility (see indicator Fertility rates), many OECD countries have seen the focus of childbearing shift to later age groups.
7 22242628303234 Mean age2019 2000 OECD FAMILY DATABASE, 3 Updated: August 2021 Click here to download the data in Microsoft Excel Format Chart Adolescent fertility rate, 1970, 1995 and 2019 or latest available Births per 1000 women, 15-19 year olds Notes: for 2019, data for Chile, Colombia and Costa Rica to 2014; for the Russian Federation to 2016; for Israel, Japan and Korea to 2017; for Mexico, New Zealand and the United Kingdom to 2018. Sources: for European countries, Eurostat Demographic Statistics; for Australia; ABS (2021), Births, Australia - ; for Canada: Statistics Canada. Table 13-10-0418-01 Crude birth rate, age-specific fertility rates and total fertility rate (live births) ; for the United States, Centres for Disease Control and Prevention: National Vital Statistics Reports - Births: Final data for all other countries, United Nations World Fertility data 2019 Comparability and data issues The disaggregation of fertility rates by mother s age is useful as a means of identifying changes in the timing of fertility which, amongst other things, affect trends in the total fertility rate ( ).
8 The age profiles above show that women are postponing childbearing with fertility declining at younger ages and increasing at older ages. The consequences of these changes in timing on overall levels of fertility are not always exactly clear but postponement of childbirth is likely to lead to the underestimation of fertility as measured by the total fertility rate (Hvidtfeldt et al, 2010). Fertility rates by birth order , tempo-controlled estimates of fertility trends or the time between two births are among the indicators that can help cast light on changes in the timing of fertility and help separate both the timing and quantum dimensions in the analysis of fertility evolution (see Potan okov et al. (2008) and other references below). Sources and further reading: OECD (2019), Rejuvenating Korea: Policies for a Changing Society. D Addio, and Mira d Ercole M. (2005), Trends and Determinants of Fertility Rates in OECD Countries: the Role of Policies , OECD Social, Employment and Migration Working Paper, No.
9 27, Paris; OECD Society at a Glance (Edition 2006); Nimwegen N. van and C. Beets (2008), The demographic situation in the European Union , in Demographic Trends, Socio-Economic Impacts and Policy Implications in the European Union, Monitoring report for the European Observatory on the Social Situation 2007; Bongaarts J., G. Feeney (2006), The quantum and tempo of life-cycle events , Vienna Yearbook of Population Research, pp. 115-51; Lutz W., and V Skirbekk (2005), Policies addressing the tempo effect in low fertility countries , Population and Development Review, 31(4):699-730; Potan okov M., T. Sobotka, and D. Philipov (2008), European Demographic data sheet - Estimating tempo effect and adjusted TFR, Vienna Institute for demography; Hvidtfeldt, U. A., M. Gerster, Knudsen andN. Keiding (2010), Are low Danish fertility rates explained by changes in timing of births? . Scandinavian journal of public health, 38(4), pp.
10 426-33. 020406080100 Births per 1000 women2019 19951970 OECD FAMILY DATABASE, 4 Updated: August 2021 Click here to download the data in Microsoft Excel Format Chart Age-fertility profiles, 1970, 1995 and 2019 or latest available Fertility rates (births per 1000 women) by five-year age group 02040608010012014016018020022024026015-1 920-2425-2930-3435-3940-4445-49 Births per 1000 womenAustralia02040608010012014016018020 022024026015-1920-2425-2930-3435-3940-44 45-49 Births per 1000 womenAustria1970199520190204060801001201 4016018020022024026015-1920-2425-2930-34 35-3940-4445-49 Births per 1000 womenBelgium0204060801001201401601802002 2024026015-1920-2425-2930-3435-3940-4445 -49 Births per 1000 womenCzech Republic02040608010012014016018020022024 026015-1920-2425-2930-3435-3940-4445-49 Births per 1000 womenChile020406080100120140160180200220 24026015-1920-2425-2930-3435-3940-4445-4 9 Births per 1000 womenFinland0204060801001201401601802002 2024026015-1920-2425-2930-3435-3940-4445 -49 Births per 1000 womenEstonia0204060801001201401601802002 2024026015-1920-2425-2930-3435-3940-4445 -49 Births per 1000 womenDenm ark0204060801001201401601802002202402601 5-1920-2425-2930-3435-3940-4445-49 Births per 1000