Transcription of Mean-Variance Optimization and the CAPM - Columbia …
1 IEOR E4706: Foundations of Financial Engineeringc 2016 by Martin HaughMean- variance Optimization and the CAPMT hese lecture notes provide an introduction to Mean-Variance analysis and the capital asset pricing model(CAPM). We begin with the Mean-Variance analysis of Markowitz (1952) when there is no risk-free asset andthen move on to the case where there is a risk-free asset available. We also discuss the difficulties ofimplementing Mean-Variance analysis in practice and outline some approaches for resolving these optimal asset allocations are typically very sensitive to estimates of expected returns and covariances,these approaches typically involve superior or more robust parameter estimation analysis leads directly to thecapital asset pricing modelor CAPM. The CAPM is a one-periodequilibrium model that provides many important insights to the problem of asset pricing.
2 The language / jargonassociated with the CAPM has become ubiquitous in Markowitz s Mean-Variance AnalysisConsider a one-period market withnsecurities which have identical expected returns and variances, [Ri] = andVar(Ri) = 2fori= 1,..,n. We also supposeCov(Ri,Rj) = 0for alli6=j. Letwidenotethe fraction of wealth invested in theithsecurity at timet= 0. Note that we must have ni=1wi= 1for anyportfolio. Consider now two portfolios:Portfolio A: 100% invested in security # 1 so thatw1= 1andwi= 0fori= 2,.., B: An equi-weighted portfolio so thatwi= 1/nfori= 1,.., the random returns of portfoliosAandB, respectively. We immediately haveE[RA] = E[RB] = Var(RA) = 2 Var(RB) = 2 two portfolios therefore have the same expected return but very different return variances. A risk-averseinvestor should clearly prefer portfolioBbecause this portfolio benefits from diversification without sacrificingany expected return.
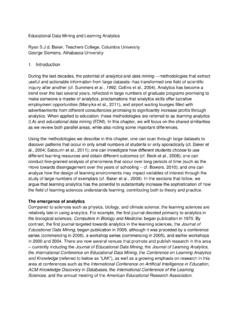
3 This was the cental insight of Markowitz who (in his framework) recognized that investorsseek to minimize variance for a given level of expected return or, equivalently, they seek to maximize expectedreturn for a given constraint on formulating and solving the mean variance problem consider Figure 1 below. There weren= 8securitieswith given mean returns, variances and covariances. We generatedm= 200random portfolios from thesensecurities and computed the expected return and volatility, standard deviation, for each of them. They areplotted in the figure and are labelled inefficient . This is because every one of these random portfolios can beimproved. In particular, for the same expected return it is possible to find an efficient portfolio with a smallervolatility. Alternatively, for the same volatility it is possible to find an efficient portfolio with higher The Efficient Frontier without a Risk-free AssetWe will consider first the Mean-Variance problem when a risk-free security is not available.
4 We assume thatthere arenrisky securities with the corresponding return vector,R, satisfyingR MVNn( , ).(1) Mean-Variance Optimization and the CAPM2 Figure 1: Sample Portfolios and the Efficient Frontier (without a Riskfree Security).The Mean-Variance portfolio Optimization problem is formulated as:minw12w w(2)subject tow =pandw 1= that the specific value ofpwill depend on the risk aversion of the investor. This is a simple quadraticoptimization problem and it can be solved via standard Lagrange multiplier the Mean-Variance Optimization problem (2).When we plot the mean portfolio return,p, against the corresponding minimal portfolio volatility / standarddeviation we obtain the so-calledportfolio frontier. We can also identify the portfolio having minimal varianceamong all risky portfolios: this is called theminimum variance portfolio.
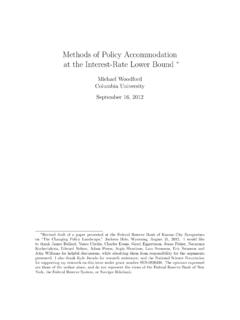
5 The points on the portfolio frontierwith expected returns greater than the minimum variance portfolio s expected return, Rmvsay, are said to lie ontheefficient frontier. The efficient frontier is plotted as the upper blue curve in Figure 1 ar alternatively, the bluecurve in Figure ( Mean-Variance ) efficient portfolios corresponding to expected returnsr1andr2, respectively, withr16=r2. Show thatallefficient portfolios can be obtained as linear combinations result of the previous exercise is sometimes referred to as a2-fund The Efficient Frontier with a Risk-free AssetWe now assume that there is a risk-free security available with risk-free rate equal torf. Letw:= (w1,..,wn) be the vector of portfolio weights on thenrisky assets so that1 ni=1wiis the weight onthe risk-free security. An investor s portfolio Optimization problem may then be formulated asminw12w w(3)subject to(1 n i=1wi)rf+w = Optimization and the CAPM3 Figure 2: The Efficient Frontier with a Riskfree optimal solution to (3) is given byw= 1( rf1)(4)where := 2min/(p rf)and 2minis the minimized variance , , twice the value of the optimal objectivefunction in (3).
6 It satisfies 2min=(p rf)2( rf1) 1( rf1)(5)where1is ann 1vector of ones. While (orp) depends on the investor s level of risk aversion it is ofteninferred from the market portfolio. For example, if we takep rfto denote the average excess market returnand 2minto denote the variance of the market return, then we can take 2min/(p rf)as the average or marketvalue of .Suppose now thatrf< Rmv. When we allow our portfolio to include the risk-free security the efficient frontierbecomes a straight line that is tangential to the risky efficient frontier and with ay-intercept equal to therisk-free rate. This is plotted as the red line in Figure 2. That the efficient frontier is a straight line when weinclude the risk-free asset is also clear from (5) where we see that minis linear inp. Note that this result is a1-fund theoremsince every investor will optimally choose to invest in a combination of the risk-free securityand a single risky portfolio, thetangency portfolio.
7 The tangency portfolio,w , is given by the optimalwof (4) except that it must be scaled so that its component sum to 1. (This scaled portfolio will not dependonp.)Exercise3 Without using (5) show that the efficient frontier is indeed a straight line as described : consider forming a portfolio of the risk-free security withanyrisky security or risky portfolio. Show thatthe mean and standard deviation of the portfolio varies linearly with where is the weight on therisk-free-security. The conclusion should now be the efficient frontier if no borrowing is ratioof a portfolio (or security) is the ratio of the expected excess return of the portfolio to theportfolio s volatility. TheSharpe optimal portfoliois the portfolio with maximum Sharpe ratio. It isstraightforward to see in our Mean-Variance framework (with a risk-free security) that the tangency portfolio,w , is the Sharpe optimal Including Portfolio ConstraintsWe can easily include linear portfolio constraints in the problem formulation and still easily solve the resultingquadratic program.
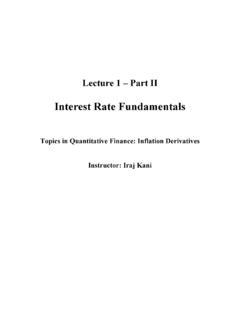
8 No-borrowing or no short-sales constraints are examples of linear constraints as are leverageMean- variance Optimization and the CAPM4and sector constraints. While analytic solutions are generally no longer available, the resulting problems are stilleasy to solve numerically. In particular, we can still determine the efficient Weaknesses of Traditional Mean-Variance AnalysisThe traditional Mean-Variance analysis of Markowitz has many weaknesses when applied naively in include:1. The tendency to produce extreme portfolios combining extreme shorts with extreme longs. As a result,portfolio managers generally do not trust these extreme weights. This problem is typically caused byestimation errors in the mean return vector and covariance 3: The Efficient Frontier, Estimated Frontiers and Realized Figure 3, for example, where we have plotted the same efficient frontier (of risky securities) as inFigure 2.
9 In practice, investors can never compute this frontier since they do not know the true meanvector and covariance matrix of returns. The best we can hope to do is to approximate it. But how mightwe do this? One approach would be to simply estimate the mean vector and covariance matrix usinghistorical data. Each of the black dashed curves in Figure 3 is anestimatedfrontier that we computed by:(i) simulatingm= 24sample returns from the true (in this case, multivariate normal) distribution (ii)estimating the mean vector and covariance matrix from this simulated data and (iii) using these estimatesto generate the (estimated) frontier. Note that the blue curve in Figure 3 is the true frontier computedusing the true mean vector and covariance first observation is that the estimated frontiers are quite random and can differ greatly from the truefrontier.
10 They may lie below or above the true frontier or they may cross it and an investor who uses suchan estimated frontier to make investment decisions may end up choosing a poor portfolio. How poor? Thedashed red curves in Figure 3 are therealizedfrontiers that depict the true portfolio mean - volatilitytradeoff that results from making decisions based on the estimated frontiers. In contrast to the estimatedfrontiers, the realized frontiers must always (why?) lie below the true frontier. In Figure 3 some of therealized frontiers lie very close to the true frontier and so in these cases an investor would do very in other cases the realized frontier is far from the (generally unobtainable) true efficient examples serve to highlight the importance of estimation errors in any asset allocation also that if we had assumed a heavy-tailed distribution for the true distribution of portfolio returnsthen we might expect to see an even greater variety of sample mean-standard deviation frontiers.