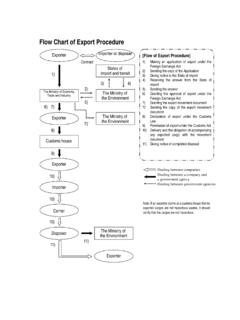
Transcription of Measurement and Regulation of Odors in the USA
1 Measurement and Regulation of Odors in the USA 62 Measurement and Regulation of Odors in the USA Thomas Mahin Massachusetts Department of Environmental Protection 205a Lowell Street Wilmington, Massachusetts 01887 USA Keywords regulations , United States, Measurement Abstract This paper will present highlights of the current approaches used in the USA relative to odor regulations and guidelines. The issue of odor standardization has progressed significantly during the last few years. In the USA, the Air & Waste Management Association s EE-6 Odor Committee has forwarded its guidelines to the American Society of Testing Materials (ASTM) as a suggested replacement for ASTM Method E679-91.
2 Among other things, the guidelines recommend a minimum flow rate of 3 liters per minute (lpm) for olfactometers. However a large number of odor laboratories in the USA have adopted the European Standard approach of a 20 lpm flow rate. The author asks whether current olfactometry based odor regulatory standards in the USA standards will now be inconsistent with the higher D/T (OU) levels that may be associated with the higher flow rates used as part of the European Standard approach? 1. Introduction Odors are increasingly the cause of complaints to environmental regulatory agencies in the USA.
3 One reason for this increase is the fact that more homes are being built near waste processing facilities such as wastewater treatment plants and landfills due to a lack of buildable land. Also as home prices have risen significantly in recent years, many residents have become less tolerant to even occasional Odors or other nuisance conditions that are perceived to have an impact on property values. In addition, in agricultural areas of the USA there has been a dramatic increase in corporate large-scale confined animal feeding operations.
4 Because most of these animal facilities do not really have significant odor treatment systems in place, there has been a significant increase in complaints and regulations relative to animal feeding operations in the USA. 2. Types of Odor Regulatory Approaches Used in the USA There are generally a number of different approaches that are commonly used in the USA to regulate Odors . (1) The use of ambient air limits for individual compounds such as hydrogen sulfide as used in the state of Minnesota (see Table 1 below). The existence of so many different odorous compounds associated with WWTPs and particularly most Measurement and Regulation of Odors in the USA 63 livestock operations creates serious potential problems when using individual compounds as the basis for assessing Odors .
5 In addition, detection and odor annoyance thresholds cited in the literature and in regulations vary widely for compounds such as hydrogen sulfide. Table 1. Examples of Ambient Standards for Odor Causing Compounds (all agencies listed are state agencies unless otherwise noted) from Mahin, 2001 (1) Location Compound Ambient Odor Standard California Hydrogen sulfide 30 ppbv* (1-hour average) Connecticut Hydrogen sulfide Methyl mercaptan ug/m3 ug/m3 Idaho Hydrogen sulfide 10 ppbv (24 hour average) 30 ppbv (30 min. average) Minnesota Hydrogen sulfide 30 ppbv (30 minute average)** 50 ppbv (30 minute average)** Nebraska Total reduced sulfur 100 ppb (30 minute average) New Mexico Hydrogen sulfide 10 ppbv (1 hour avg.)
6 Or 30 - 100 ppbv (30 minute avg.) New York State Hydrogen sulfide 10 ppbv (14 ug/m3) 1-hour average New York City Hydrogen sulfide 1 ppbv (for wastewater plants) North Dakota Hydrogen sulfide 50 ppbv (instantaneous, two readings 15 min. apart) Pennsylvania Hydrogen sulfide 100 ppbv (1 hour average) 5 ppbv (24 hour average) Texas Hydrogen sulfide 80 ppbv (30 minute avg.) - residential/commercial & 120 ppbv - industrial, vacant or range lands * - parts per billion by volume ** - not to be exceeded more than 2 days in a 5-day period ** - not to be exceeded more than 2 times per year (2) General regulatory language that prohibits off-site nuisance or annoyance conditions as determined by field inspectors in response to complaints from the public.
7 Some agencies have implemented procedures whereby inspectors rate the intensity of the odor in the field, based on an intensity scale. Six point scales are sometimes used with 1 = very weak, 2 = weak, 3 = distinct, 4 = strong, 5 = very strong and 6 = extremely strong. The advantage to this approach is its simplicity and the fact that it is not a theoretical value predicted by a model. One disadvantage for both this approach and the hydrogen sulfide hand-held meter approach is that odor nuisance conditions occur much more frequently in the evening and early morning when regulatory staff are usually not working.
8 (3) Off-site limits based on levels predicted by dispersion modeling and using the dynamic olfactometry approach with the criteria reported as odor units (OU), Measurement and Regulation of Odors in the USA 64 OU/m3 or dilutions/threshold (D/T). The terms D/T, OU/m3 and OU will be used interchangeably in this paper since they all represent the same concept (see Table 2 below). (4) Best available control technology (BACT) or similar approaches that specify required levels of odor treatment controls for new or upgraded large facilities.
9 (5) The American Society of Agricultural Engineering (ASAE) document Engineering Practice Control of Manure Odors recommends setbacks from livestock facilities of to km for neighboring residences and km to residential development (2). Table 2 Examples of OU/m3 (D/T) Limits Used from Mahin (1) Location Off-site standard or guideline Averaging times Allegheny County Wastewater Treatment Plant (WWTP) 4 D/T (design goal) 2-minutes San Francisco Bay Area Air Quality District 5 D/T Applied after at least 10 complaints within 90-days State of Colorado 7 D/T (Scentometer) State of Connecticut 7 D/T State of Massachusetts 5 D/T* State of New Jersey 5 D/T ** 5-minutes or less State of North Dakota 2 D/T (Scentometer)
10 State of Oregon 1 to 2 D/T 15-minutes City of Oakland, CA 50 D/T 3-minute City of San Diego WWTP 5 D/T 5-minutes City of Seattle WWTP 5 D/T 5-minutes * draft policy and guidance for composting facilities ** for biosolids/sludge handling and treatment facilities The European Committee for Standardization or CEN has developed a standard method for odor laboratory Measurement using olfactometry. The standard, which is to be called Air Quality Determination of Odour Concentration by Dynamic Olfactometry will be referred to in this paper as the European Standard (3).