Transcription of Measurement of Glass Transition Temperatures by Dynamic ...
1 1 RH100RH100 Measurement of Glass Transition Temperatures by Dynamic Mechanical Analysis and RheologyKeywords: DMA, Thermal, Rheology, Glass Transition , TgBACKGROUNDT ransitions in polymeric materials provide invaluable information about the material. This information is often used for quality control, predicting product performance, and informing processing conditions or heat history . When heating a polymer from the glassy state it transitions from a hard and brittle material to a softer rubbery material with more viscous properties. This is the Glass Transition . Think of polycarbonate, polyethylene terephthalate, or polyvinyl chloride polymers for examples of a glassy polymer at room temperature.
2 These would be everyday materials such as a plastic suitcase exterior, water bottle, or piping. Polypropylene, polyethylene, and many rubber polymers are good examples of materials in the rubbery state at room temperature and these materials are commonly found in squeeze bottles, tubing, and (obviously) rubber. The Glass Transition is heavily influenced by such factors as the crystallinity of the polymer, crosslinking, and plasticizers. The Glass Transition s sensitivity to these factors makes it an ideal parameter to quantify for quality control purposes and to see the influence of these factors on the performance and processing of polymers.
3 This note will detail the use of Dynamic mechanical analysis (DMA) and rheology to characterize the Glass Transition of a polymeric material. Glass TRANSITIONSThe Glass Transition occurs over a range of Temperatures and is not a point or single temperature. It is helpful to define unambiguous points within the Transition region to characterize the Glass Transition which we will refer to as Tg. Often the Glass Transition is reported as a single temperature but the details of how it was determined are needed to make any quantitative comparison of two Glass Transition temperature depends on the polymer but is heavily influenced by many factors that will be discussed in the applications section.
4 Dynamic mechanical analysis (DMA) is one analytical technique to determine Tg. The common experiment to determine Tg via DMA is to ramp the temperature of a specimen while applying a small-amplitude linear oscillation to measure the Dynamic moduli E , E , and tan( ). Similar experiments are performed on a rheometer, typically in parallel plate or torsional mode in shear deformation, which will provide G , G , and tan( ). The method of determining the Glass Transition points is identical for either extensional or shear deformation and should yield identical results in isotropic materials.
5 Materials that are anisotropic may exhibit differences in the measured Tg depending on the direction or type of deformation. The measured Tg is sensitive to the frequency of the oscillation but independent of the amplitude within a small region that is easily Tg can also be measured by other techniques, such as differential scanning calorimetry (DSC) and thermomechanical analysis (TMA), but are beyond the scope for this note. Rheological and DMA techniques are particularly sensitive to the Glass Transition compared to DSC and TMA. A Transition that can be difficult to detect via DSC and TMA is often more easily analyzed via the methods detailed are three ways to measure or describe the Glass Transition temperature using rheological methods and DMA: the onset of E /G ; taking the peak value of E /G , and the peak value of tan( ).
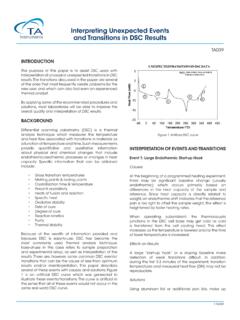
6 The detailed analysis methods are discussed Transition FROM THE STORAGE MODULUSThe Glass Transition from the storage modulus onset is typically the lowest Tg measured by DMA and rheological methods. This method is a good indicator of when the mechanical strength of the material begins to fail at higher Temperatures and is particularly useful for determining the useable range for a load bearing 1. Tg ( C) of polycarbonate using manual tangent (onset point) and inflection. Data collected on the DMA 850 with a mm single cantilever clamp. A heating rate of 3 C/min was used for this determination of this point requires some consideration that will be discussed here.
7 The Tg from the loss modulus and tan( ) require much less consideration and are covered later. Conceptually the method is simple. The general method is to calculate the intercept from two lines; one from the glassy plateau of the storage modulus and the other after the sudden drop of the storage modulus in the Transition region (Figure 1). There are several different mathematical ways to construct the tangent and calculate the intercept. The mathematical method chosen can change the value of Tg determined. The multiple methods to draw Storage modulus E (MPa)Manual Tangent1st CDerivative of Storage ModulusIn CManual Tangent2nd CIn ection PointX: CY: MPaOnset CTemperature T ( C)1051041031021011001201301401501601702 RH100these tangents are why the onset Tg requires more consideration than the Tg from the loss modulus or tan( ) example using a manual tangent and inflection methods for the onset and Transition parameters in TRIOS is shown in Figure 1.
8 This analysis is similar to some ASTM methods (D 7028 07, E 1640 04) for the onset Tg. A tangent can be determined in two ways; a fit between two points or one point and the slope at that point. The manual tangent method has the user select two points manually and a line is fit to the data between them. Ideally these points would result in a fit from a consistently flat and linear region of the glassy plateau that isn t too close to the Transition region. These points are labelled in the figure as the manual tangent 1st point and manual tangent 2nd point. This is our first line.
9 We will generate the second line from the inflection method. The inflection point is the point on the storage modulus with the highest magnitude slope in the Transition region. This point is the labelled in the figure on the plot of the derivative of the storage modulus. The slope at this minimum and the point at which it occurs are used to create another line. Be aware that the analysis range must contain the minimum of the derivative for correct results. Generating quality data with a smooth derivative peak is also key to consistent results. The calculated intersection of the two lines is the onset Tg as user can also manually select points for the glassy region and Transition region or even have the lines determined by the endpoints of the analysis region using the default tangent selection in TRIOS.
10 Selecting the tangent method will use the first of the curve x axis to fit the first line and/or the last to fit the second line and determine the intercept between them. This requires the least input from the user but is most subjective to the analysis region observed Tg from any rheological/DMA technique increases with the oscillation frequency. It is important to consider this when using the Tg measured from the storage modulus to determine the useable temperature range for a material. The material begins to soften significantly at the Tg for deformations on the timescale of 1/frequency, or 1 second for the results in Figure 1.