Transcription of Measurement Systems Analysis - GHSP: Solutions in Motion
1 A JSJ Business Measurement Systems Analysis Components and Acceptance Criteria Rev: 11/06/2012 A JSJ Business Purpose To understand key concepts of Measurement Systems Analysis To understand potential sources of Measurement error and its affect on both process and part quality A JSJ Business Why Do We Care About Measurement Systems Analysis (MSA)? Ensures Measurement is accurate and precise Eliminates false data that can impact decisions about the process Provides information about the gage (s) being used to evaluate our parts and processes Reduces risk in calling good parts bad (Type I Error) **Impacts internal throughput, scrap and rework Reduces risk in calling bad parts good (Type II Error) **Impacts customer Data you can trust = Good Decisions A JSJ Business Which line has less variation?
2 Line 1 Line 2 A JSJ Business Which line has less variation? Line 1 Line 2 gage Variation Total Variation A JSJ Business Which line has less variation? Line 1 Line 2 gage Variation Total Variation Part Variation Part Variation + gage Variation = Total Variation (Observed) Line 2 has Less variation A JSJ Business Understanding Variation Part Variation + gage Variation = Total Variation (Observed) What is the best course of action? Assume the total observed variation is below Ppk for an initial process study on a starred dimension ( Ppk or greater required) a different sample of parts (Gather more data) process changes to reduce process variation gage changes to reduce Measurement variation A JSJ Business How do you decide what to do?
3 What are typical reactions to measuring a part out of tolerance? Adjust processes / implement additional detection methods Quarantine / Sort / Scrap parts Review PFMEAs and Control Plans Before doing all this verify the Measurement system A JSJ Business MSA Components What does a Measurement system Analysis consist of? A JSJ Business MSA Components Resolution (Discrimination) Accuracy Linearity Stability Repeatability (Test / Retest) Reproducibility gage R&R A JSJ Business Sources of Variation Location of the Measurements Accuracy / Bias Stability Linearity Variation of Measurement Repeatability Reproducibility Resolution / Discrimination Each source of variation can result in incorrect measurements A JSJ Business Resolution Can the gage detect change?
4 Which logo below is larger? How is the Measurement different? A JSJ Business Resolution - Response Select gages that have greater levels of discrimination (smaller increments) Record all Measurement data, if a gage measures to 3 decimal points record all three As a general rule gage discrimination should be 1/10th of the product tolerance Product tolerance: gage tolerance: (Recommended minimum) A JSJ Business Accuracy What is accuracy? The difference between the measured average value and the master value or the Shift from True value The master value needs to come from a traceable Measurement source (ex.)
5 CMM) Although accuracy and bias are often used interchangeably it is best practice to refer to this difference in values as bias A JSJ Business Accuracy What is accuracy? Measured values Master value (reference standard) Let s assume the master value is 5 Let s also assume the average Measurement is In this case the accuracy of the gage is bias by above the master A JSJ Business How to Determine Bias Take three samples Ideally these samples would be at the high, middle and low ends of the process Determine the reference value for each sample using a traceable Measurement method (CMM, calibrated height gage , etc.
6 Measure each sample at least 10 times. Calculate the average and subtract from the reference value Determine if the accuracy is acceptable or needs to be corrected This is to be determined by the working team A JSJ Business Bias Example Note: With multiple samples a linearity study may be completed A JSJ Business Potential Bias Causes gage needs calibration Worn gage , equipment or fixture Error in master part (worn or damaged) Improper setting of master in gage Differing Measurement methods (set, loading, clamping, technique, etc.) Environment (temperature, humidity, vibration, cleanliness, etc.) A JSJ Business Bias - Response Increase calibration schedule Implement gage operating instructions Verify gage was made to correct specifications Check gage for wear Cleaning of gage Evaluate gage environment A JSJ Business Linearity What is linearity?
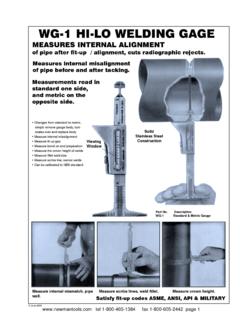
7 Linearity is the change in bias across the operating range of the gage A JSJ Business Linearity Bias No Bias (Master value equals measured average value) (Difference between the measured average value and the master value) Full Range of gage (Master Value) Measured Average Value Note the bias and increasing variance A JSJ Business How to Determine Linearity Pick 5 parts covering the entire product tolerance Determine reference value of each part (ex. CMM) Measure each part 10 times or more and determine averages Subtract the average values from the determined reference values and decide if linearity is acceptable A JSJ Business Linearity Calculation (Minitab) 1.
8 Enter Part Number, Measurement and Reference Value in the Worksheet 2. Go to Stat , Quality Tools , gage Study , gage Linearity and Bias Study in column ID s for Part Number, Reference Values and Measurement Data. Don t forget to fill in the gage Info! A JSJ Business Linearity Analysis (Minitab) This gage has little bias between and However, there is significant bias (P< ) at and A JSJ Business Linearity - Acceptance Criteria Study must use 5 or more parts Parts must cover entire operating range of gage A p-value of less than (P< ) indicates statistically significant bias A JSJ Business Linearity Response Implement correction factor / table / curve Review gage and adjust Restrict use of range (Need to consider specification limits) Verify proper calibration (through entire operating range)
9 Verify part / fixture is not distorted with change in part size A JSJ Business Linearity Question Question: Is this linearity study acceptable? , all points are statistically acceptable across the range , at there is significant bias , at and there is significant bias is no bias, this is a linearity study A JSJ Business Stability What is stability? The variation in measurements obtained with the same master part(s) on a single feature over a period of time Also known as Measurement drift and the change in bias over time A JSJ Business Stability Measurements taken Monday Measurements taken Friday Measurement results are changing over time.
10 gage is not stable A JSJ Business How to Determine Stability Select a master part Part may be a reference part (master) or a production part You can select multiple parts (low, middle and high end of expected range) and track stability for each Determine the reference value for each part via a master Measurement method Measure each part 3 5 times at a chosen interval (daily, weekly, etc.) Frequency should be determined based on knowledge of the gage . If frequency is unclear you should start at a high frequency and reduce over time as deemed acceptable. Plot the ongoing data on a Xbar & R chart A JSJ Business Stability Potential Causes Calibration issues gage wear Poor maintenance Master part damage / wear A JSJ Business Stability Response Increase frequency of calibration Increase frequency of PM Change / Adjust gage Establish life of gage or master part A JSJ Business Stability Question Question: Assuming the same part was measured is this gage stable?