Transcription of Measuring of dynamic figures: SNR, THD, SFDR
1 Ab Measuring of dynamic figures : SNR, THD, SFDR. Overview The quality and accuracy of a high-speed A/D or D/A instrument depends on a number of different components. The most important of these is the converter itself. But the amplifier, board layout, clock source and the power supply also have an influence on the quality of the complete system. An acknowledged test method to characterise A/D or D/A products is based on spectral analysis. The recorded data is converted using the FFT technique; the graphical display of this allows a range of different frequency domain specifications to be measured. We measure the following key parameters for the UltraFast boards: SNR (signal to noise ratio). THD (total harmonic distortion). SFDR (spurious free dynamic range). ENOB (effective number of bits). Test methods from major A/D chip manufacturers and calculations from standard specialist references are used so that the characterisation of the UltraFast boards is made in a manner that is comparable worldwide.
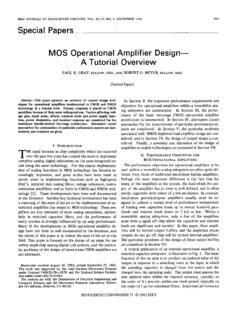
2 Test setup Pure sinewave generator Sharp-edged low-pass UltraFast A/D board PC with FFT analysis with low noise and low filter with cut-off frequency under test software distortion at 110% of test frequency Rohde + Schwarz SML01 TTE LC7 series The diagram shows the standard test setup that is used to measure the key parameters in development and production. To obtain correct results it is absolutely necessary to use a high quality pure sinewave signal. There is no fast signal generator on the market that produces a sinewave that could be directly used to measure dynamic parameters of 12-bit or higher resolution A/D converters. To cut off any harmonic and spurious distortion from the signal source, a sharp-edged low-pass filter must be used. The cut-off frequency of the filter is always slightly higher than the test frequency.
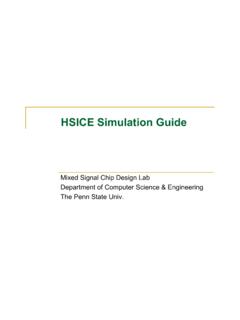
3 To minimise the recording of any environmental noise the complete system is used with 50. Ohm termination. The signal amplitude must be between 99% and 100% of the full-scale range. The input signal must be checked for clipping and saturation. The measurement could be performed with the SBench software supplied with the UltraFast boards. Calculation of dynamic parameters To calculate the dynamic parameters we use an acquisition memory of 4k points. The signal amplitude is set to 99% of the input range. To minimise phase errors of the on-board clock generator we use the on-board quartz clock and disable the PLL in software. The time-domain acquisition is time-weighted by a Hanning-window. A standard FFT calculation is performed and generates a 2k points FFT plot. To calculate the fundamental and harmonics energy we include a number of bins on either side of these components.
4 The bin size depends on the resolution of the ADC: 8 bit 10 bins 12 bit 15 bins 14 bit 20 bins 16 bit 20 bins From the FFT plot SNR, THD, SFDR, SINAD and ENOB are calculated. To get typical values the results of 20 calculations are averaged Calculation basics SNR: Signal-to-Noise Ratio. This figure characterises the ratio of the fundamental signal to the noise spectrum. The noise spectrum includes all non-fundamental spectral components in the Nyquist frequency range (sampling frequency / 2). without the DC component, the fundamental itself and the harmonics: SNR = 20 * log ([Fundamental] / SQRT (SUM (SQR([Noise])))). THD: Total Harmonic Distortion. The harmonic distortion characterises the ratio of the sum of the harmonics to the fundamental signal. Normally there are the first 6 harmonics used for the characterisation.
5 THD = 20 * log (SQRT (SUM (SQR ([Harmonics]))) / [Fundamental]). SFDR: Spurious Free dynamic Range. The figure for spurious free dynamic range (sometimes also called only dynamic range) characterises the ratio between the fundamental signal and the highest spurious in the spectrum. In some definitions the harmonics are excluded from this calculation, in some times they are included. SFDR = 20 * log ([Fundamental] / [Highest Spurious]). SINAD: Signal-to-Noise And Distortion. It's the combination of SNR and THD figure: SINAD = 20 * log ([Fundamental] / SQRT (SUM (SQR([Noise + Harmonics])))). ENOB: Effective Number Of Bits. This figure tells how close the A/D-converter board is near to the theoretical mathematical model. The ENOB is normally calculated from the SINAD value but sometimes calculated from the SNR value only.
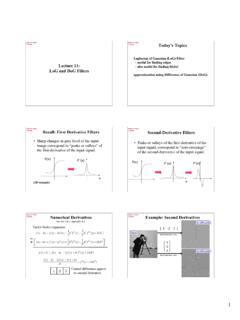
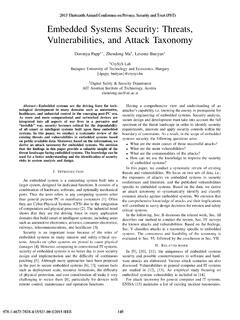
6 ENOB = (SINAD ) / Weighting window: In real-world applications the sampling frequency normally is not an integer multiple of the test signal frequency. As a result of this there are some frequency side lobes. To reduce them for the measurement a weighting windows is used. The use of the Hanning-window is recommended for this. Bin size: In an ideal measurement the fundamental as well as the harmonics would only be a one point peak in the FFT spectrum. One can get near to this ideal value if the sampling frequency is an integer multiple of the test frequency. But in real world where the test signal has a phase jitter and the sampling frequency is asynchronous to the test signal frequency one gets a several points wide peak for fundamental and harmonics (as shown in the picture). To minimise calculation errors it is necessary to include a larger bin of points in the calculation for fundamental and harmonics energy.
7 Comparing results of different companies Comparing the dynamic performance of products from different companies must be done very carefully. Some companies have their own way of calculating the dynamic parameters or only use the specifications from the ADC. To compare the results found in a current UltraFast datasheet with the results of other products, the following topics must be kept in mind and must be carefully investigated: Single figures : Integer values like: 67 dB SNR without any explanation under which circumstances they have been measured normally mean that this figure is just taken from the ADC datasheet without doing real world measurements. Every SNR, THD and SFDR figure is only valid for a single setup. To compare these figures one must at least know the used input range, sampling speed and signal frequency to understand how these figures have been calculated.
8 ENOB: There are two main calculations for the ENOB value. One is based on the SINAD (SNR and THD), the other one only on SNR. We use the more common method of basing the ENOB value on the SINAD. Compared to a calculation that uses only SNR the figure will be worse. See the above calculation basics for formulas. SFDR: There are two methods to state the SFDR figure. In one method the harmonic distortion is ignored (stated in UltraFast data sheets as exc. harm.) and SFDR is only calculated for all spurious parts. This is the most common method employed worldwide. The other method to calculate SFDR includes the harmonics (stated as incl. harm.). In this figure there could be a fairly large difference between the two calculation methods depending on the harmonic distortion of the system. System: The test system that is used for the calculation can have a major influence on the SNR and RMS noise figures .
9 Some power supplies are very well shielded and don't generate spurious noise on the ground and supply lines, other (cheaper) power supplies generate significant levels of noise. To obtain a real-world characterisation we only use off-the-shelf standard systems to measure the dynamic parameters. There are no optimised systems or optimised power supplies used.