Transcription of Measuring Physically Effective Fiber On-Farm to Predict ...
1 Measuring Physically Effective Fiber On-Farm TO Predict COW RESPONSE K. W. Cotanch and R. J. Grant W. H. Miner Agricultural Research Institute Chazy, NY INTRODUCTION This paper is a follow-up to our 2005 Cornell Nutrition Conference paper entitled Physically Effective Fiber for dairy cows: current perspectives . That paper provided a contemporary review of the concept of Physically Effective NDF (peNDF), the important assumptions inherent in the peNDF system, and preliminary work conducted at the Institute comparing commonly used particle-sizing systems. Presented here is an overview of the latest published research investigating animal response to dietary peNDF concentrations and the efficacy of various methods of On-Farm peNDF determination. It is important to understand the peNDF concept as originally defined by Mertens (1997) in order to properly evaluate current or proposed methodologies to monitor ration peNDF levels.
2 Remember that peNDF was originally defined, from an analytical perspective, as the proportion of the original sample NDF that is found in particles retained on the sieve when a dry forage or feed sample is sieved using a vertical shaking method (such as with the Tyler Ro-Tap equipment). By plotting ruminal pH by dietary peNDF derived from a review of literature, Mertens (1997) proposed that to ensure a ruminal pH of , dietary peNDF should be maintained at or above 21%. This has become the gold standard reference value for dietary peNDF. For On-Farm application, the concept of peNDF has since been simplified to the proportion of DM retained as particles larger than the sieve following dry vertical sieving multiplied by the %NDF of the sample, assuming an equal distribution of NDF between particles larger and smaller than the mm sieve.
3 This simplification is valid for many samples but less so for samples with considerable amounts of fine, non-NDF particulate matter, such as high concentrate total mixed rations (TMR). Regardless, the proportion of sample DM > sieve is commonly used as the physical effectiveness factor (pef) in the equation: peNDF = pef x %NDF. Various methods have been proposed for the determination of pef using as fed forages in order to simplify the methodology and make it usable On-Farm rather than requiring laboratory drying and analysis. Some of these methods include the Penn State Particle Separator (PSPS) wire mesh screen (PSPS ; Kononoff et al., 2003), the total proportion of sample retained by the PSPS top 2 screens (19 mm and 8 mm; ; Yang and Beauchemin, 2006 as an example), and the recently developed Z-Box system briefly described by Grant and Cotanch (2005) that uses and sieves.
4 The question remains as to whether these On-Farm particle-sizing tools yield pef values similar to the standard dry sieving method (Mertens, 1997). It has been assumed that the On-Farm tools provide measures of pef for forages and TMR that compare favorably with the target of 21% peNDF proposed by Mertens (1997) based on dry sieving. CURRENT RESEARCH AND VARIABLE COW RESPONSE TO PENDF Recent research investigating animal response to varied dietary peNDF concentrations as measured by the various particle separator techniques has been inconclusive. There appear to be differences in the ability of the various On-Farm methods to measure pef values that mimic the pef measured using the standard dry sieving technique. Yang and Beauchemin (2006a, c) fed barley silage-based diets of varying peNDF content to lactating dairy cows and observed the effect on chewing activity and ruminal pH.
5 The dietary peNDF content was determined using the method, the proportion of DM retained by the top-2 screens of the Penn State Particle Separator. Samples were presumably sieved as is, and proportion retained on each sieve was expressed on DM basis. An important point to consider is the fact that the dynamics of sieving a moist sample versus a dried sample do not equate to the expression of as-is sieving data on a DM basis. The process of drying the sample prior to sieving shrinks the particles resulting in a downward shift of particle size and peNDF value. The peNDF values of the TMR fed were , and for the high, medium and low peNDF diets. Refusals were analyzed to calculate the peNDF of the diet actually consumed, which resulted in peNDF of , and , respectively. Note that these dietary peNDF values are well below the recommended concentration of 21% of DM for maintaining rumen pH above (Mertens, 1997).
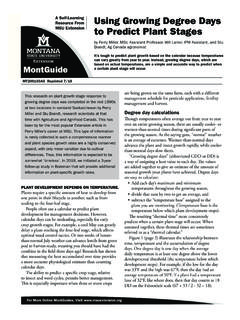
6 When the ruminal pH values for each diet are plotted on the peNDF x pH figure in Mertens (1997), it would Predict that all three diets should result in ruminal pH in the to range, Figure 1a. The mean ruminal pH values observed were , and for the high, medium and low peNDF diets, with no significant differences by diet. Also, it is noteworthy that the cows consumed more peNDF than was fed in the TMR, suggesting sorting for long Fiber and against fines, reverse sorting . This response by peNDF also would indicate some degree of ruminal acidosis. There were no dietary effects on eating; only min/d of ruminating was significantly affected by diet (P < ). Yang and Beauchemin (2006b) conducted a similar trial with a corn silage-based TMR, Measuring peNDF as either or the dry sieve method to obtain The high, medium and low Fiber diets had values of , , and , and of , , and Note the indicates that the TMR should be low in peNDF, Figure 1b.
7 , whereas the dry-sieve values indicate high peNDF values that should result in ruminal pH values greater than , figure 1c. The mean ruminal pH values were , and across diets and did not differ significantly among the diets. These data do not support the idea that is accurate in determining peNDF compared with the dry sieving method. The lack of difference in ruminal pH across diets is not unexpected as all 3 diets had values much greater than 21. In order to document a dietary difference in chewing time or ruminal pH, it would be ideal to have treatments that bracket the critical peNDF value of 21. Zebeli et al. (2006) conducted a meta-analysis of research trials examining peNDF measurements and cow responses. They reviewed 33 research experiments that used and (or) that monitored feed intake, chewing activity, ruminal fermentation, milk parameters, and digestibility.
8 Their findings indicated that was poorly related to ruminal pH (R2= ), whereas was more closely associated to ruminal pH (R2= ). However, was poorly associated with daily chewing (R2= ) and rumination (R2= ). This is troubling because the original biological definition of peNDF was as the fraction of NDF that stimulates chewing and forms the ruminal digesta mat (Mertens, 1997). Milk parameters were less sensitive to dietary peNDF, which is not surprising. Inclusion of forage digestible organic matter (FDOM) and rumen degradable starch intake (RDSI) improved the accuracy of rumen pH prediction of their models, indicating the importance of chemical composition and fermentability along with physical dimension of feed particles which again makes sense. The Zebeli et al. (2006) review also reaffirmed the concept that to maintain ruminal pH above required a dietary of 19%, as determined by dry vertical sieving, similar to the value that Mertens originally proposed of 21% of DM.
9 The use of to estimate peNDF was not advised based on this meta-analysis. Figure 1. Ruminal pH data compared with original data from Mertens (1997) for Yang and Beauchemin (2006a, b, c). B C A DEVELOPMENT OF THE Z-BOX METHOD FOR On-Farm ASSESSMENT OF PENDF Despite the variable cow response to diets differing in peNDF, the need for a method to accurately determine peNDF with moist, as-fed samples still remains. Currently, nutritional models such as CNCPS and CPM-Dairy require peNDF as a key input to Predict microbial output and animal response. Consequently, even though we still do not totally understand how to accurately Predict cow response, nutritionists in the field require an On-Farm system that results in pef values that agree with the standard method since it is most highly correlated with ruminal pH. The Z-Box system, previously developed at Miner Institute in cooperation with the Zen-Noh National Federation of Agricultural Co-operative Associations of Japan, appears to be such a device.
10 The Z-Box is a 21 x 21 x 11 cm molded plastic box fitted with a clear plastic side and an open side for insertion of interchangeable sieves. The sieves that were evaluated were made of perforated steel with hole sizes of , , , and mm similar to the dimensions of the sieves used in Mertens (1997) dry sieving procedure. Table 1 contains the sieve specifications. Table 1. Specifications for the sieves used in development of the Z-Box tool for On-Farm measurement of physical effectiveness factors. Hole diameter (mm) Pattern Open area (%) Thickness (mm) straight 36 diagonal 33 diagonal 40 diagonal 50 diagonal 51 A series of tests were conducted to determine the method that most accurately estimated as determined by dry sieving.