Transcription of Measuring Suspended Solids in Water/Wastewater
1 Measuring Suspended Solids in water /WastewaterWater Analysis Instruments, Thermo Fisher ScientificApplication Note 021 Key Wordssuspended Solids , total Suspended Solids , water and wastewater treatment, water quality, turbidity, online measurement, sediment, process, monitoring, Thermo Scientific AquaSensors DataStick GoalThis application note explores the topic of Suspended Solids and total Suspended Solids , including how and why they are measured in water and wastewater treatment processes. What are Suspended Solids and Total Suspended Solids ? Measuring Suspended Solids in water is used for control of various treatment processes and for examination of wastewater quality.
2 The level of Suspended Solids (or total Suspended Solids ) in water and wastewater affect the quality of the water and how it can be Measure Suspended Solids OnlineMeasuring Suspended Solids online allows for instantaneous monitoring and control of the process where the sensor is installed. Suspended Solids measurements may be useful in any process where Suspended Solids are present or are removed, such as coagulation and flocculation, settling, clarification, precipitation, and filtration. Examples of applications include: In filtration processes Control of chemical doses for Solids removal Correlation of process conditions vs. Solids removal Verification of Solids removal Alarms and shut down for out of control conditions Compliance with regulatory requirementsThese applications are important in water treatment, wastewater treatment, water quality monitoring, industrial wastewater treatment, oil field water treatment, and similar markets and Total Suspended Solids in the LabTotal Suspended Solids (TSS) is measured in laboratories by filtering a known volume of a sample, drying the filter and captured Solids , then weighing the filter to determine the weight of the captured Suspended Solids in the sample.
3 TSS is calculated as follows:TSS (mg/L) = (Wfss Wf)/VsWhere:Wfss: weight of filter with Suspended solidsWf: weight of the filterVs: volume of sampleThe entire process takes about 2 hours (or more) and does not lend itself to instantaneous, continuous measurement. See ASTM D5907, EPA Method , Standard Methods 2540D or similar gravimetric method for details of the lab Suspended Solids OnlineThe presence of Suspended Solids (SS) in a sample affects the light scattering properties (the turbidity) of the sample. In general, the amount of light scatter is proportional to the amount of SS in the sample. Therefore, if we measure the turbidity (light scattering) of the sample, then we can relate it to the TSS/SS of the sample.
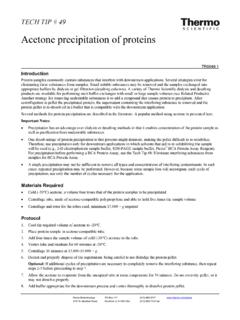
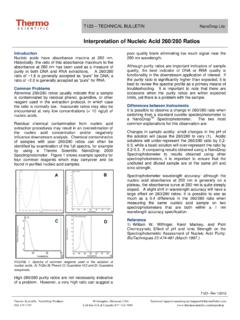
4 The chart below shows an example of how turbidity and TSS may be untreated sample where the Solids are still Suspended will appear opaque (high turbidity). Conversely, the sample will be clearer (low turbidity) after treatment. In a settling treatment tank, the top portion of the sample will be clear. Installing a SS sensor at the top of the treatment tank or after the treatment process can give information about when the Solids settling treatment is finished and/or how complete is the Solids removal after the treatment. By choosing the location of the sensor and Measuring the turbidity of the sample at that point, we can determine the SS instantaneously and Calibration of the Suspended Solids SensorSuspended Solids sensors are typically factory-calibrated in units of mg/L or ppm by using suspensions of weighed Solids in water .
5 Diatomaceous earth (DE), primarily composed of silicon dioxide (SiO2) is commonly used. DE is a historic standard used for turbidity calibrations and serves as a useful reference for Suspended Solids sensors. The Thermo Scientific AquaSensors Datastick Suspended Solids Measurement System is calibrated using Calibration of the SensorWhat happens when the sample or process being measured is not SiO2 or DE, like the factory calibration? Since most samples are not exactly like SiO2/DE, the results from the SS sensor will trend with laboratory TSS results, but may be biased high or biased low, depending on how the process sample differs from SiO2/DE. Every sample stream can be expected to have its own light scattering properties, which can be correlated to its Suspended solid content.
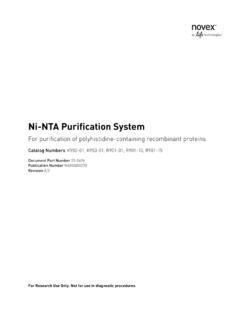
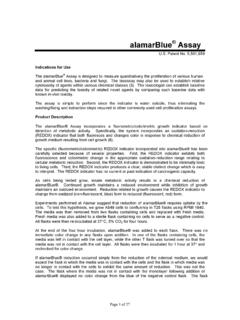
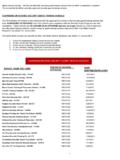
6 The following chart shows how different samples can have different correlations between turbidity and Suspended it is desirable to match the online SS sensor readings to the laboratory TSS results, there must be a sample-specific calibration of the SS sensor. This can be done by generating a correlation or by a calibration update, according to user for Sample-Specific CalibrationCorrelation method: Prepare a correlation between the lab TSS results and the online SS sensor results. To do this, collect samples at the SS sensor location. Note the SS sensor reading and send the sample to the lab for TSS testing. After repeating this process 10 20 times, graph the sensor reading against the lab results to make a correlation chart.
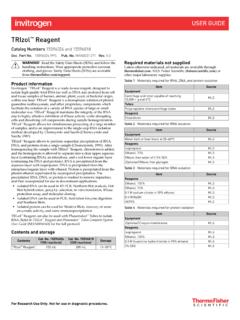
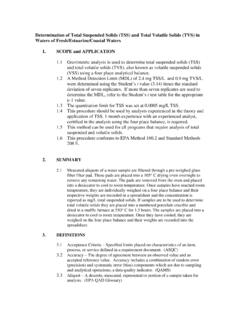
7 The equation from the chart allows the sensor reading to be converted to an equivalent lab reading by calculation. A correlation chart might look like this:Calibration update method: Perform a one-point calibration update of the sensor based on lab TSS results. Collect a large volume of sample. Send a portion to the lab for TSS testing. Store the rest at 6 C. When the lab results are available, warm the sample back up to process temperature, stir, and place the SS sensor into the sample. Perform a one-point calibration update by entering the lab TSS result into the calibration. After this calibration, the SS sensor should read a value similar to the lab Sensor Reading (mg/L)Lab TSS Reading (mg/L)Lab vs.
8 Sensor SS Correlationy = - R = vs. TurbidityTurbidity, NTUTSS, mg/LTSS = (Turb)R = Sample-Specific Calibration is Better?Preparing a correlation using multiple samples takes longer, but can account for effects such as daily or seasonal variations, temperature changes, and concentration changes. It depends on how many correlation samples are collected and what conditions are present when collected. In this way, using a correlation can be more accurate, when it is important to match sensor results to lab , performing a one-point calibration update can be faster and may be sufficient when the sample stream does not vary much and a tight agreement between sensor results and lab results is not and Sampling ConfigurationThe AquaSensors Datastick Suspended Solids measurement system uses an infrared light-emitting diode (LED) light source and ratio-metric optical geometry in the sensor design.
9 This means that interferences from color, other light-absorbing substances, and ambient light are minimized. Changes to the sensor optical windows tend to cancel out. The LED output is stable and does not require replacement or frequent recalibration. When installing the SS sensor, it should be placed to avoid trapping bubbles and avoid light reflections, which can interfere. Bubbles can occur when dissolved gases come out of solution due to an increase in water temperature or a decrease in water pressure. Pumping and sparging can also introduce bubbles. If sample stream velocity is too high, floc shear may occur ( at the clarifier effluent) and affect the readings. Avoid placing the sensor where sediment may accumulate.
10 Install an air or water purge wash system to keep the sensor cleaner for longer periods of time and reduce maintenance and Care of the SensorThe LED light source of the AquaSensors DataStick Suspended Solids measurement system is robust, stable, and long lasting. It does not require replacement. When the wash hardware has been installed with the SS sensor, an air or water purge will help keep the sensor clean for longer periods. However, the sample can eventually coat and obscure the optical windows of the sensor and affect the performance. Periodically clean the sensor windows with a warm (not hot) 1% detergent solution and a soft brush to remove biofilm, grease, and oil.