Transcription of Mechanical Analysis of Soil
1 Mechanical Analysis of Soil Geotechnical engineering studies rock and soilsupporting civil engineering systems. Knowledge from the field of soil science, materialsscience, mechanics, and hydraulics is applied to safely and economically design foundations, retaining walls, andother structures. Identification of soil properties presents challenges togeotechnical engineers. Unlike steel or concrete, the material properties andbehavior of soil are difficult to predict due to its variability and limitation on Analysis of Soil As complex as it is, soil can be described simply.
2 It consists of four major components: air, water, organicmatter, and mineral Analysis of Soil The structure of soil determines its suitability for concrete,road subsurface, building foundation, or filter media. Soil has four constituent parts: Sand is any soil particle larger than millimeters ( inches). Silt is any soil particle from - millimeters. Clay is any soil particle below millimeters, including colloidal clay so small it does not settle out of suspension inwater. Mechanical Analysis of SoilMechanical Analysis of SoilMechanical Analysis of Soil The percentage distribution of those parts determines soilstructure.
3 Mechanical Analysis is the determination of the size rangeof particles present in a soil, expressed as a percentage ofthe total dry weight. There are two methods generally used to find the particle-size distribution of soil: (1) sieve Analysis - for particle sizes larger than mmin diameter, and (2) hydrometer Analysis - for particle sizes smaller than mm in diameter. CIVL 1101 Introduction to Sieve Analysis1/7 Mechanical Analysis of SoilThe percentage distribution of those parts determines soil structure. Mechanical Analysis of SoilSieve analysisHydrometer analysisSieve Analysis Sieve Analysis consists of shaking the soil sample through a set of sieves that have progressively smaller openings.
4 Sieve Analysis Sieve Analysis consists of shaking the soil sample through a set of sieves that have progressively smaller openings. Sieve AnalysisSieve Number Opening (mm) 4 6 8 10 16 20 30 40 50 60 80 100 140 170 200 270 Sieve Analysis First the soil is oven dried and then all lumps are broken into small particle before they are passed through the sieves After the completion of the shaking period the mass of soil retained on each sieve is determinedCIVL 1101 Introduction to Sieve Analysis2/7 Mass of soilSieve # Diameter retained on PercentCumlative Percent(mm) each sieve (g) retained (%) retained (%) finer (%)
5 = results of sieve Analysis are generally expressed in terms of the percentage of the total weight of soil that passed through different sievesSieve AnalysisMass of soilSieve # Diameter retained on PercentCumlative Percent(mm) each sieve (g) retained (%) retained (%) finer (%) = results of sieve Analysis are generally expressed in terms of the percentage of the total weight of soil that passed through different sievesSieve AnalysisParticle-Size Distribution CurveEnd of Part 1 Particle-Size Distribution Curve The results of Mechanical Analysis (sieve and hydrometer analyses) are generally presented by semi-logarithmic plots known as particle-size distribution curves.
6 The particle diameters are plotted in log scale, and the corresponding percent finer in arithmetic scale. Particle-Size Distribution CurveSilt and claySandParticle diameter (mm)Percent finer (%) to g each sieve which is to be used2. Select with care a test sample which is representativeof the soil to be tested3. Weigh to a specimen of approximately 500 g of oven-dried soil4. Sieve the soil through a nest of sieves by hand shaking. At least 10 minutes of hand sieving is desirable for soils with small particles. 5. Weigh to g each sieve and the pan with the soil retained on Subtract the weights obtained in step 1 from those of step 5 to give the weight of soil retained on each sieve.
7 The sum of these retained weights should be checked against the original soil weight. Recommended ProcedureCIVL 1101 Introduction to Sieve Analysis3/7 Percentage retained on any sieve:Calculations100%weight of soil retainedtotal soil weight Cumulative percentage retained on any sieve:Percentage retained Percentage finer than an sieve size:100%Percentage retained Effective Size, Uniformity Coefficient, and Coefficient of Gradation Three basic soil parameters can be determined from these grain-size distribution curves: Effective size Uniformity coefficient Coefficient of gradation The diameter in the particle-size distribution curve corresponding to 10% finer is defined as the effective size, or D10.
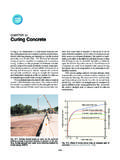
8 Particle diameter (mm)Percent finer (%)Effective Size, Uniformity Coefficient, and Coefficient of GradationFind D10:How do youread this?Reading Semi-Logarithmic Scales In science and engineering, a semi-log graph or semi-log plot is a way of visualizing data that are changing with an exponential relationship. One axis is plotted on a logarithmic scale. This kind of plot is useful when one of the variables being plotted covers a large range of values and the other has only a restricted range The advantage being that it can bring out features in the data that would not easily be seen if both variables had been plotted Semi-Logarithmic Scales To facilitate use with logarithmic tables, one usually takes logs to base 10 or e Let s look at the log Semi-Logarithmic Scales To facilitate use with logarithmic tables.
9 One usually takes logs to base 10 or e Let s look at some values on a log scale and practice interpolation 1101 Introduction to Sieve Analysis4/7 Particle diameter (mm)Percent finer (%)Effective Size, Uniformity Coefficient, and Coefficient of GradationFind D10:Particle diameter (mm)Percent finer (%)Effective Size, Uniformity Coefficient, and Coefficient of mmThe uniformity coefficientis given by the relation6010uDCD where D60is the diameter corresponding to 60% finer in the particle-size distributionEffective Size, Uniformity Coefficient, and Coefficient of GradationEffective Size, Uniformity Coefficient, and Coefficient of GradationParticle diameter (mm)Percent finer (%)D60= mmFind D60.
10 The coefficient of gradationmay he expressed as2301060cDCDD where D30is the diameter corresponding to 30% finer in the particle-size distributionEffective Size, Uniformity Coefficient, and Coefficient of GradationEffective Size, Uniformity Coefficient, and Coefficient of GradationParticle diameter (mm)Percent finer (%)D30= mmFind D30:CIVL 1101 Introduction to Sieve Analysis5/7 For the particle-size distribution curve we just used, the values of D10, D30, and D60are:D10= mmD30= mmD60= mm6010uDCD 2301060cDCDD 2( ) Effective Size, Uniformity Coefficient, and Coefficient of GradationParticle diameter (mm)Percent finer (%) The particle-size distribution curve shows not only the range of particle sizes present in a soil but also the type of distribution of various size Size, Uniformity Coefficient, and Coefficient of GradationParticle diameter (mm)Percent finer (%)