Transcription of Mechanisms of central color vision - CNBC
1 503 Mechanisms of central color vision Hidehiko Komatsu In monkey cerebral cortex, color information is processed along the ventral visual pathway. This pathway starts in the primary visual cortex and ends in area TE of the inferior temporal cortex. Recent studies indicate that the transformation of cone signals occurs early in the pathway to form neurons selective to a narrow range of hues. In addition, it has become apparent that area TE plays a vital role in color discrimination. Addresses Laboratory of Neural Control, National Institute for Physiological Sciences, Myodaiji, Okazaki-shi, Aichi, 444-8585, Japan; e-mail: Current Opinion in Neurobiology 1998, 8:503-508 0 Current Biology Pubilcations ISSN 0959-4388 Abbreviations 0 blue co cytochrome oxidase G green IT inferior temporal cortex K koniocellular L long LGN lateral geniculate nucleus M middle pLGN parvocellular layer of the LGN R red S short TE anterior part of IT Vl primary visual cortex Y yellow Introduction color perception arises from the comparison of signals from photoreceptors with different spectral sensitivity functions.
2 Macaque monkeys have three types of cone photoreceptors that are maximally sensitive to long (L), middle (hl), and short (S) wavelengths (Figure 1, stage 1). Comparison of signals from different types of cones occurs in the retinal circuit, and after a relay at the lateral geniculate nucleus (LGiY), color information is transmitted to the cerebral cortex. This review focuses on color processing in the cerebral cortex; however, I begin with a description of color -related signals in the LGN, which is important for understanding the input signals to the cerebral cortex. Precortical stage of color processing color -opponent cells In the LGN, there are txvo classes of neurons with chromatic opponency [1,2]. One class of neurons is excited by red light but inhibited by green light, or vice velsa; these neurons are referred to as red/green or R/G color opponent cells. Another class of neurons differentially responds to blue and yellow light; these neurons are known as yellow/blue or Y/S color -opponent cells (Figure 1, stage 2).
3 R/G color -opponent cells receive signals from L and hl cones in opposite polarities ( +L -Xl or -L +Rl). Y/B color -opponent cells receive signals from S cones and the sum of L and hl cones in opposite polarities ( S-[L+hl)) [2Pl]. Responses of these neurons to color stimuli are well represented by rhr linear sum of cone signals. The existence of two classes of color -opponent cells in the LGN indicates that there are only two chromatic channels at this stage of color processing. Krauskopf et al. [S] identified three cardinal directions in color space in which adaptation in one direction did not affect rhe detection threshold in the other directions. One of these is luminance modular_ion, lvhercas the other Iwo correspond precisely to the direcrions in color space to which color -opponent LGiX neurons are tuned [3]. Although the trvo classes of color -opponent LGN neurons might be associated with the t\vo color -opponent Mechanisms proposed initially by Hering \6], they do not correspond to each ocher because Hering s unique hues do not coincide with the directions of the cardinal axes.
4 S cone inputs to primary visual cortex In the past-, it \vas generally thought that there exists a single subcortical pathway for color that involves midget retinal ganglion cells, and after a relay in the parvocellular layer of the LGN (pLGN), terminates in layer 4C(3 or 4A of the primary visual cortex (Vl). Recent studies indicate that there exists another pathway for color that involves interlaminar (koniocellular, or K) layers of the LGN located ventral to each principal layer. A distinct retinal ganglion cell type, the small bistratified cell [7], receives excitatory inputs from S cones (81 and projects to the K layers of the LGN (RC Reid, JM Alonso, SHC Hendry, Sot AJeurosci A&r 1997, 23:13). Neurons in K layers, in turn, project to cytochrome oxidase (CO) blobs in layers 2 and 3 of Vl (19,101; see also [ll]). Neurons chat are activated by modulation of S cone signals are found in and around K layers of the LGN ([12,13*]; RC Reid, Jhl Alonso, SHC Hendry, SocNeurusciAbstr 1997, 23:13).))
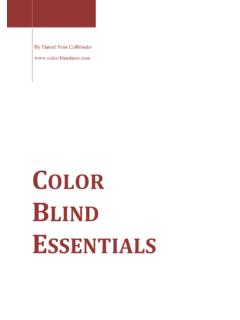
5 Thus, these experiments provide converging lines of evidence that color -opponent signals sensitive to S cone excitation are transmitted to the cortex, at least in part, through direct input to the CO blobs in Vl via the K layers of the LGN. Early cortical Mechanisms color selectivity of Vl neurons It has been shown rhat color -selective Vl neurons have receptive field structures that are not found in the LGN: some Vl neurons exhibit orientation selectivity as well as color selectivity [14,15], whereas others exhibit 504 Sensory systems Figure 1 Stages 1 4 Cone Retinal ganglinon cell LGN (parvocellular and Vl, v2 Linear combmatton Nonlinear operation lllumlnatlon 5 v4 a Inferior temporal cortex Current Op,n,on ,n Neurobtology Hypothetical scheme of color processing at different stages along the visual pathway. Five different stages are shown. The first stage consists of three types of cone photoreceptors (S, M and L). In the second stage, there are two classes of color -opponent cells (Y/B and R/G).)
6 The outputs of color -opponent cells are linearly combined in the primary visual cortex (Vl) to form neurons tuned to various directions in color space at the third stage. Nonlinear interactions of the signals from these neurons occur at the fourth stage, which involves Vl and V2, and cells tuned to a narrow range of hue or saturation are formed. The effect of illumination is discounted at the fifth stage, which involves V4, to form neurons whose responses parallel the perceived surface color as a result of color constancy. Different color processing stages in the cortex are indicated by different shadings. double opponency [16,17] or broadband suppression from Lennie et a/. [Zl] studied the responses of Vl neurons the receptive field surround [18]. With regard to the to modulation of color along various directions in color specificity to color , however, a clear distinction between space. They found that the direction in color space in the LGN and Vl is not indicated by experiments testing which maximum activation occurs differed from cell to spectral sensitivity or wavelength-response relation using cell.
7 This is clearly different from the LGN, in which monochromatic lights. Though spectral bandwidth differs the preferred direction coincides with the cardinal axes from cell to cell, most neurons seem to have a peak of the color space. Other recent studies have also shown sensitivity to red, yellow, green, or blue colors [l&20]. that preferred color is variable across different Vl neurons More recently, experiments using color stimuli based on ([Z?]; A Hanazawq I Murakami, H Kondo, H Komatsu, color space revealed a clear difference in color specificity Sot Neurosci Abstr 1997, 23: 1026). Many psychophysical between Vl and LGN. studies suggest the presence of higher-order chromatic Mechanisms of central color vision Komatsu 505 Mechanisms tuned to more than two directions in color space [23-751, and the variety of color preferences observed in Vl is consistent with this suggestion. Linear summation of cone signals Both perceptual color space ( Krauskopf s color space; SW [S]) and cone space, which represents the activation of three types of cones, are three dimensional and are related by a linear transformation.]
8 Thus, the responses mapped in color space provide useful information for estimating the input cone signals to a given neuron. Lennie it al. [21] examined the color selectivity of Vl neurons by modulating stimulus color along various directions in color space and found that the activities of most neurons change in a regular way, indicating that these neurons receive inputs that are the linear sum of the cone signals. color -selective LGN neurons behave in the same manner [.3]. \Vhen the responses of such neurons to various iso- luminant colors are plotted on a chromaticity diagram ( Commission Internationale de I Eclairage [CIE] xy chromaticity diagram), the contour line connecting positions Tvith the same response magnitude was logically expected to be aligned on a straight line [26]. \Ve found this to be the case for nearly all color -selective neurons examined in the LGN, and also for many color -selective \ l neurons (A Hanazawa, I hlurakami, H Kondo, H Komatsu, Sor ~l rruos~i Abs;rrr 1997, 23:1026).
9 In these studies, holvever, a clear difference was found between LGN and Vl with regard to the relative weights tvith lvhich different types of cone signals fed into each neuron. In contrast with the LGN, lvhere only a limited number of combinations of cone signals are observed, relative weights of cone signals differ from cell to cell in Vl. These results suggest that the outputs of the two classes of color -opponent cells ( R/G and Y/B cells) in the LGN are linearly combined in Vl with various weights to form color -selective neurons tuned to various directions in color space (Figure 1, stage 3). De Yalois and colleagut% (27,28 ] have proposed a model that assumes that signals from Y/B cells in the LGN are linearly combined with the signals from R/G cells at some cortical stage to form neurons tuned to unique hues. Their model is consistent with the observation that the outputs from LGN neurons are linearly combined in Vl, though combinations of LGIi signals are not limited, as their model would predict.)
10 Similarly, when color selectivity of neurons in areas \ 2 and \ 3 were examined using a method very similar to those used by Derrington eta/. [3] and Lennie eta/. [Zl], it was observed that neurons in these areas, which are driven by linear combinations of cone signals, are tuned to various directions in color space [29,30**,31*]. Nonlinear interaction of cone signals In the study mentioned above, Lennie rl al. [Zl] found that a few Vl neurons had sharp color selectivity, which cannot be explained as a linear combination of cone signals. They noted that they may have underestimated the proportion of such neurons in their work. Recent studies have confirmed the existence of such neurons (A H anazawa, I hlurakami. H Komatsu, Sac &UVSC~ Al/srr 1996, 22:640; KP Cottaris, SD Elfar, LE Mahon, RI, De \ alois, Sor ~Veurusci Ahtr- 1997, 23:13). In our experiment, a significant proportion of neurons had responses that clearly produced curved contour lines in chromaticity diagrams, suggesting a nonlinear interaction of cone signals (Figure 1, stage 4).