Transcription of MEDI-CAL COVID-19 VACCINATIONS
1 MEDI-CAL COVID-19 VACCINATIONS (for beneficiaries all ages)December 2022 DHCS recognizes the disproportionate impact of COVID-19 on disadvantaged communities, including many communities of color, which account for a large share of the MEDI-CAL beneficiary population. Until recently, our knowledge of the extent of COVID-19 vaccination among the MEDI-CAL population was limited to what was gathered from claims data. Now, with new linkages to immunization registry data from the California Department of Public Health, DHCS has a much clearer view of MEDI-CAL vaccination rates compared to statewide rates, stratified by county and by health plan. While MEDI-CAL COVID-19 vaccination rates are gradually improving across the state, the percentage of MEDI-CAL beneficiaries with at least one dose lags the population-at-large rate, sometimes by as much as 30 percent.
2 2 DHCS is strengthening its efforts to work with managed care plans, local public health departments, agencies and stakeholders serving our homebound populations, as well as providers, health systems and community-based organizations to improve vaccination rates and help ensure that our beneficiaries are protected against infection from current and emerging strains. To support and empower our partners with data and transparency, we will update and publish this data on a monthly basis to support monitoring of progress and to guide further interventions. 3 Recent Updates In July 2022, CDPH began calculating vaccine coverage for all ages to reflect new vaccine eligibility criteria. Previously the denominator changed from ages 16+ to ages 12+ in May 2021, and from ages 12+ to ages 5+ in November 2021.
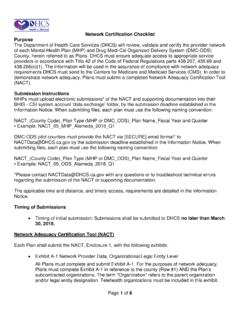
3 Starting in May 2022, MEDI-CAL vaccination rates reflect currenteligibility demographic information in lieu of eligibility information at the time the dose was administered. Managed care rates experienced an increase due to newly enrolled beneficiaries transitioning from fee-for-service to managed care, and the implementation of CalAIMdual eligible enrollment on January 1, 2022. In November 2021, CDPH shifted to using the most recent version of the California Department of Finance P-3 Population Projections (July 2021) for statewide and county-level rates. 4 Received at least one dose as of October 31, 2022 Percentage for all ages, by countyNote: MEDI-CAL beneficiaries are a subset of all CaliforniansAll Californians All MEDI-CAL Beneficiaries5 Received at least one dose as of October 31, 2022 Percentage for all ages, by countyComparing MEDI-CAL Beneficiaries to all residentsCountyAll CaliforniansMedi-Cal CaliforniansMedi-Cal : Statewide rates are calculated using the California Department of Finance P-3 projections for the denominator.
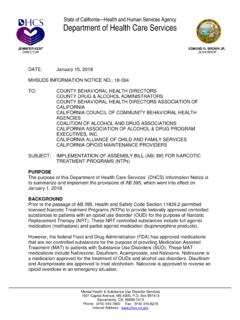
4 Estimates may slightly vary from the true at least one dose as of October 31, 2022 Percentage for all ages, by countyComparing MEDI-CAL Beneficiaries to all residentsCountyAll CaliforniansMedi-Cal Luis CaliforniansMedi-Cal l a : Statewide rates are calculated using the California Department of Finance P-3 projections for the denominator. Estimates may slightly vary from the true at least one dose as of October 31, 2022 Comparing MEDI-CAL Beneficiaries to all 0- 4 Ages 5- 11 Ages 12-17 Ages 18-49 Ages 50-64 Ages 65+Percent of People All Ages who Received at Least One DoseAge GroupsMedi-CalStatewide8 Note: Statewide rates are calculated using the California Department of Finance P-3 projections for the denominator.
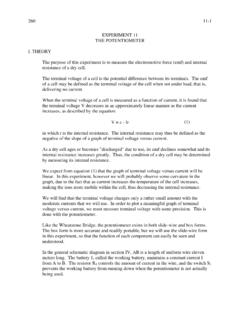
5 Estimates may slightly vary from the true at least one dose as of October 31, 2022 Comparing MEDI-CAL Beneficiaries to all of People All Ages who Received at Least One DoseRace/EthnicityMedi-CalStatewideNote: Statewide rates are calculated using the California Department of Finance P-3 projections for the denominator. Estimates may slightly vary from the true at least one dose as of October 31, 2022 Comparing MEDI-CAL Beneficiaries to all Californians, Ages of People Ages 0-17 who Received at Least One DoseRace/EthnicityMedi-CalStatewideNote: Statewide rates are calculated using the California Department of Finance P-3 projections for the denominator. Estimates may slightly vary from the true Care Parent PlanPercent of MEDI-CAL Beneficiaries (allages) Administered at Least One DosePercent of MEDI-CAL Beneficiaries (5+) Administered at Least One DoseCentral California Alliance for Health Plan of Better Health of Blue Cross Partnership Healthcare of Health & Wellness Plan of San Empire Health Health For of MEDI-CAL Beneficiaries administered at least one dose as of October 31, 2022 by Managed Care Parent Plan and Fee For ServiceManaged Care Parent PlanPercent of MEDI-CAL Beneficiaries (all ages)Administered at Least One DosePercent of MEDI-CAL Beneficiaries (5+)
6 Administered at Least One DoseSan Francisco Health Plan of San Clara Family Health Alliance for Costa Health Care Health Shield of California Health Coast Health is using the Healthy Places Index (HPI), which reflects 25 community characteristics using data related to the economy, education, healthcare access, housing, neighborhoods, clean environment, transportation, and social environment. California s 1650+ ZIP codes have been divided into four quartiles based on the HPI Index. Those with the highest HPI scores correlate to better health outcomes, while those with lower scores (first quartile) reflect worse health outcomes. In general, higher HPI scores also correlate with higher household incomes, and lower HPI scores correlate with lower incomes.
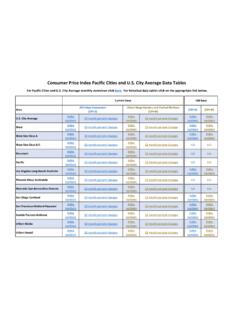
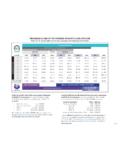
7 Vaccine Equity Metric (VEM) score quartiles combine the Public Health Alliance of Southern California s Healthy Places Index (HPI) measure with CDPH-derived scores to estimate factors that impact health, like income, education, and access to health care. The Vaccine Equity Metric is for weekly vaccination allocation and reporting purposes only. Equitable Vaccine Administration Fact Sheet ( ) Equity Metric (VEM)12 COVID-19 Vaccination Status as of October 31, 2022CA vs. MEDI-CAL - by Community Conditions13 All Californians MEDI-CAL BeneficiariesCOVID-19 Vaccination Status as of October 31, 2022CA vs. MEDI-CAL - by Community Conditions14 All CaliforniansQuartilesFullyVaccinatedPart ially VaccinatedNotYe tVaccinatedTo t a lQuartiles %Fully VaccinatedPartially VaccinatedNotYe tVaccinatedTo t a lQuartile 16,880,863 986,505 2,750,275 10,617,643 Quartile 26,918,551 751,456 2,232,769 9,902,776 Quartile 36,860,906 655,568 1,880,532 9,397,006 Quartile 47,747,041 661,196 890,460 9,298,697 Quartile t a l28,407,3613,054,7257,754,036 39,216, VaccinatedPartially VaccinatedNotYe tVaccinatedTo t a lQuartiles %Fully VaccinatedPartially VaccinatedNotYe tVaccinatedTo t a lQuartile 12,970,281310,8493,363,6666,644,796 Quartile 22,128,960170,3481,986,0594,285,367 Quartile 31,362,32196,3751,145,4552,604.
8 151 Quartile 4954,22957,042589,6571,600,928 Quartile t a l7,415,791634,6147,084,83715,135, : Statewide counts for the Not Yet Vaccinated are estimates and may slightly vary from the true COVID-19 Vaccination Status Data sources: DHCS Data: Eligibility data from the MEDI-CAL Data Warehouse Management Information System/Decision Support System CDPH Data: COVID-19 vaccination data from the California Immunization Registry. Data does not include doses administered by federal agencies who received vaccines allocated directly from CDC. DHCS receives COVID-19 vaccination data every Monday, links it securely to MEDI-CAL eligibility data and loads it to the COVID-19 reporting module. The lag time between VACCINATIONS and the corresponding data might be several days.
9 15