Transcription of MEDIA STATEMENT LOCAL GOVERNMENT REVENUE AND …
1 MEDIA STATEMENT . LOCAL GOVERNMENT REVENUE AND EXPENDITURE: SECOND QUARTER LOCAL . GOVERNMENT SECTION 71 REPORT. FOR THE PERIOD: 1 OCTOBER 2021 31 DECEMBER 2021. National Treasury has released the LOCAL GOVERNMENT REVENUE and expenditure report for the second quarter of the 2021/22 financial year. This report covers the performance against the adopted budgets of LOCAL GOVERNMENT for the second quarter of the municipal financial year ending on 31 December 2021 and includes spending against conditional grant allocations for the same period. The report was prepared by using figures from the Municipal Standard Chart of Account (mSCOA). data strings. The mSCOA Regulations were promulgated on 22 April 2014 and prescribes the uniform recording and classification of municipal budget and financial information at a transaction level.
2 All municipalities and municipal entities had to comply with the Regulations by 01 July 2017. The mSCOA Regulations require that municipalities upload their budget and financial information in a data string format to the LOCAL GOVERNMENT portal across the six mSCOA. regulated segments. The report is part of the In-year Management, Monitoring and Reporting System for LOCAL GOVERNMENT (IYM), which enables provincial and national GOVERNMENT to exercise oversight over municipalities and identify possible challenges in implementing municipal budgets and conditional grants . The credibility of the information contained in the mSCOA data strings is a concern but is improving as the reform is maturing. At the core of the problem is: The incorrect use of the mSCOA and municipal accounting practices by municipalities.
3 A large number of municipalities are not budgeting, transacting and reporting directly in and from their core financial systems. Instead, they prepare their budgets and reports on an excel spreadsheet and then import the excel spreadsheets into the system. Often this manipulation of data lead to unauthorised, irregular, fruitful and wasteful (UIFW) expenditure and fraud and corruption as the controls that are built into the core financial systems are not triggered and transactions go through that should not; and Municipalities are not locking their adopted budgets or their financial systems at month-end to ensure prudent financial management. To enforce municipalities to lock their budgets and close their financial system at month-end in 2021/22, the LOCAL GOVERNMENT Portal will be locked at the end of each quarter.
4 System vendors were also requested to build this functionality into their municipal financial systems. The actual COVID-19 expenditure reported by municipalities for the second quarter of the 2021/22 municipal financial year is included as a separate Annexure to this publication. Enquiries: Communications Unit Email: Tel: (012) 315 5046. The Section 71 report facilitates transparency in reporting, better in-year management as well as the oversight of the financial performance of municipalities against their adopted budgets. This report is, therefore, a management tool that serve as an early warning mechanism for councils, provincial legislatures and municipal management to monitor and improve municipal performance timeously. The improvement of the credibility of the data strings is a priority for national and provincial treasuries and the submitted data strings are analysed monthly and errors are communicated to municipalities for correction.
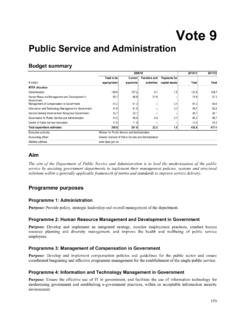
5 KEY TRENDS: Aggregate trends 1. On aggregate, municipalities spent 45 per cent, or billion, of the total adopted expenditure budget of billion as at 31 December 2021 (second quarter results for the 2021/22 financial year). In respect of REVENUE , aggregate billing and other REVENUE amounted to per cent, or billion, of the total adopted REVENUE budget of billion. 2. Of the adopted operating expenditure budget amounting to billion, billion or per cent was spent by 31 December 2021. 3. Municipalities have adopted the budget for salaries and wages expenditure at R138 billion (including remuneration of councillors), which is billion more than the adopted budget of billion reported in the second quarter of the 2021/22 municipal financial year. This constitutes per cent of their total adopted operational expenditure budget of billion.
6 As at 31 December 2021, spending on salaries and wages is per cent, or billion. 4. In the period under review, capital expenditure amounted to billion, or per cent, of the adopted capital budget of R69 billion. 5. Aggregated year-to-date operating expenditure for metros amounts to billion, or per cent, of their adopted budget expenditure of R268 billion. The aggregated adopted capital budget for metros in the 2021/22 financial year is billion, of which per cent, or billion, has been spent as at 31 December 2021. 6. When billed REVENUE is measured against their adopted budgets, the performance of metros reflects a surplus for the second quarter of the 2021/22 financial year. This does not take into account the collection rate: Billed water REVENUE billed was billion against expenditure of billion.
7 Energy sources REVENUE billed was billion against expenditure of billion;. The REVENUE billed for waste water management was billion against expenditure of billion, and Levies for waste management billed were billion against expenditure billion. 7. As at 31 December 2021, aggregated REVENUE for secondary cities is per cent or R37 billion of their total adopted REVENUE budget of R72 billion for the 2021/22 financial year. A year-on-year comparison shows that the total REVENUE on average has decreased Enquiries: Communications Unit Email: Tel: (012) 315 5046. by per cent when compared to the same period in 2020/21. The year-to-date aggregated operating expenditure level of the secondary cities is per cent or billion of the total adopted operating budget of billion for the 2021/22 financial year.
8 8. The performance against the adopted budget for the three core services for the secondary cities for the second quarter 2021/22 also shows deficit position against billed REVENUE without taking into account the collection rate: Water REVENUE billed was billion against expenditure of billion;. Energy sources REVENUE billed was billion against expenditure of billion;. The REVENUE billed for waste water management was billion against expenditure of billion; and Levies for waste management billed were billion against expenditure of billion. 9. Capital spending levels are low at an average of 32 per cent or billion of the adopted capital budget of billion. 10. Aggregate municipal consumer debts amounted to billion (compared to billion reported in the second quarter of 2020/21) as at 31 December 2021.
9 GOVERNMENT debt accounts for per cent, or billion ( billion reported in the first quarter of 2021/22) of the total outstanding debtors. The largest component of this debt relates to households which account for per cent or billion ( per cent or billion in the first quarter of the current financial year). 11. Included in the outstanding debt is an amount of billion, which is debt older than 90. days (historic debt that has accumulated over an extended period), interest on arrears and other recoveries which may not be realistically collectable by municipalities. 12. If consumer debt is limited to below 90 days, then the actual realistically collectable amount is estimated at billion. This should not be interpreted that the National Treasury by implication suggests that the balance must be written-off by municipalities.
10 13. Metropolitan municipalities are owed billion ( billion reported in the second quarter of 2020/21) in outstanding debt as of 31 December 2021. The largest contributors were the Cities of Johannesburg at per cent, Ekurhuleni at per cent, eThekwini at per cent, Tshwane at per cent and Nelson Mandela Bay at per cent. 14. Households in metropolitan areas are reported to account for billion or per cent of outstanding debt, followed by businesses that account for billion or per cent. Debt owed by GOVERNMENT agencies is at billion or per cent of the total outstanding debt owed to metros. 15. Secondary cities are owed billion ( billion reported in the second quarter of 2020/21) in outstanding consumer debt. The majority of debt is owed by households, which amount to billion, or per cent, of the total outstanding debt.