Transcription of Mediation Analysiswith Logistic Regression
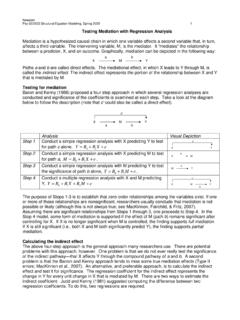
1 Newsom Psy 525/625 Categorical Data analysis , Spring 2021 1 Mediation analysis with Logistic Regression Mediation is a hypothesized causal chain in which one variable affects a second variable that, in turn, affects a third variable. The intervening variable, M, is the mediator. It mediates the relationship between a predictor, X, and an outcome. Graphically, Mediation can be depicted in Figure below: Figure Figure Figure Paths a and b are called direct effects. The mediational path, in which X leads to Y through M, is called the indirect Baron and Kenny (1986) proposed a widely cited method of investigating Mediation through a series of three simple Regression models, establishing a significant relationship for each unstandardized Regression coefficient, a, b, and c, depicted in Figures and Mediation was then indicated by results from a third, multiple Regression model, with both X and M predicting Y.
2 Full Mediation is indicated by the results if the relationship between X and Y was eliminated entirely when M is controlled ( , c is non-significant), and partial Mediation is indicated by the reduction but not the elimination of the X to Y relationship. This approach is a less precise and potentially inaccurate method of testing for Mediation , because a true mediational relationship may exist if some of these relationships are not found or if there is a more complex set of associations among the three variables (MacKinnon, Fairchild, & Fritz, 2007). The current approach ( , MacKinnon, 2008) involves the computation of an indirect effect coefficient that is a function of the compound pathway a and b from Figure together (Note: the b path in the product is the partial Regression coefficient of Y regressed on X when M is also in the model).
3 In ordinary least squares Regression , the difference between the direct effect of X on Y with and without M, c c from separate Regression models depicted in Figures and (Judd & Kenny, 1981), and the product of the two paths from the model shown in Figure , ab (Sobel, 1962), are equivalent. In either case, the indirect effect coefficient gives the change in Y for each unit change in X as mediated through M. A significant indirect effect coefficient is evidence consistent with a mediational hypothesis, but it does not prove that the causal pathway is the reason for the associations. Combined with experimental, longitudinal, or other design features, one may eliminate some of the alternative explanations, however, and strengthen the case for a possible causal pathway. Mediation analysis with Logistic Regression Because of the nonlinear nature of Logistic Regression , the two methods for calculating the indirect effect, ab and c c , are no longer equivalent (Winship & Mare, 1983) if either M or Y are binary, particularly with rarer outcomes.
4 The discrepancy between the methods can also vary with the presence of covariates in the model. There are several possible solutions to the problem (see also Iacobucci, 2012a; Imai, Keele, & Tingley, 2010; Kenny, 2013; MacKinnon, Lockwood, Brown, & Wang, 2007; Valeri & VanderWeele, 2013), one of which is to standardize the variables, and then compute the ab product. Special attention needs to be paid to the variance of the binary dependent variable when standardizing either path coefficient. Standardizing the a path, for example, would use the usual formula for converting an unstandardized coefficient to a standardized coefficient using the standard deviations of X and M for the first path, a* = a(Sx/SM), but using a special computation of the standard deviation of a binary M variable, 222/3 Mxsas =+.
5 The mathematical constant divided by 3 is an estimate of the binomial distribution variance. If Y is also binary, an analogous standardization of the second path, b, would be 1 This is perhaps the most common notation. MacKinnon and colleagues ( , Mackinnon 2008) use and for the direct paths between the predictor X and mediator M and between the mediator and the outcome Y and and for the paths between X and Y. XMYabXYcXMYbc Newsom Psy 525/625 Categorical Data analysis , Spring 2021 2 used. The standardization method nearly eliminates the discrepancy between ab and the c c indirect coefficient computations (MacKinnon & Dwyer 1993; MacKinnon et al., 2007). The product of the standardize paths, (a* )(b*), is then divided by a standard error estimate computed as a function of the standard deviations of the two variables (Sobel, 1962) or computed from a bootstrap resampling approach.
6 Using Odds Ratios or Proportion Mediated for the Magnitude of the Indirect Effect An odds ratio for the indirect effect can be defined, but its interpretation becomes considerably more complex. For a simpler case, when both M and Y are binary, the odds ratio for the indirect effect represents the odds of Y given X for the value of M1 as compared with the value M0 (VanderWeele & Vandsteelandt, 2010). VanderWeele & Vandsteelandt also suggest corrections to the odds ratio for rarer outcomes (generally with outcome < .10). If the predictor is continuous in the a or b path, the odds ratio involves a unit change interpretation that adds additional complexity. The odds ratio may also be unstable if the relationships among the variables are weak (MacKinnon, Warsi, & Dwyer, 1995). One can estimate the proportion mediated, ab/(c + ab), as a way to gauge the magnitude of the indirect effect, but MacKinnon and colleagues (2007) find that it also is unstable with sample sizes less than 500.
7 Vanderweele (2016) suggests a computation of the proportion mediated using odds ratios for the direct ( direct) and indirect ( indirect) effects, where proportion mediated = direct( indrect 1)/( direct* indirect 1), although this approach has not been evaluated extensively. Probit Models An additional proposed solution is to estimated the models involving a binary outcome with probit analysis . Probit Regression , discussed in the next section of the course, is an alternative to Logistic Regression that uses an assumed normal error distribution and lends itself to standardized coefficients more readily. The probit mediational approach still performs better with the product approach than the difference approach (c c ) to the indirect coefficient, but it also requires rescaling. Coefficient standardization is a bit more straightforward with probit than logit, so rescaling prior to computation of the indirect path is potentially clearer.
8 The probit method appears to perform relatively well with sample sizes of 200 or more given the correct model and when distributional assumptions are met (MacKinnon et al., 2007). Software Examples There are several ways to test Mediation in current software programs, 2 although I will only illustrate use of Hayes PROCESS macro in SPSS, R and SAS3 and the probit (WLSMV) approach in Mplus and lavaan in R. The PROCESS macro and the Mplus methods allows the user to specify more than one mediator (as well as combinations of moderators and mediators) as well as covariates, but I will keep the illustrations simple here. Structural equation modeling packages, can also be used with some greater flexibility including multiple predictors and mediators and latent variables. Some packages, such as Mplus (Muth n & Muth n, 1998-2012; see also Chapter 8 in Muth n, Muth n, & Asparouhov, 2017 for detail and illustrations), have incorporated Sobel and bootstrap approaches to the standard errors and statistical tests.
9 The Mplus approach can be used with the diagonal weighted least squares approach (estimator=WLSMV), which is a probit analysis and for which standardized coefficients are available (addressing the scaling issue described above). The examples below use negative exchanges (w1neg), depression (w1cesd9), and heart disease (w1hheart) from the LLSSE study (also used in the Logistic Regression handout). The hypothesized mediational model is that negative exchanges lead to depression which, in turn, lead to heart disease, w1neg w1cesd9 w1hheart. 2 There are other software approaches available including macros developed by Valeri and Vanderweele (2013). The mediations function from the Mediation package in R is yet another possibility (and there are several other R functions that simulate the PROCESS macro or domediation).
10 3 Warning: I am not clear on the approach of the PROCESS macro to standardization for the computation of the product ab in the Logistic case (or whether there is one). Newsom Psy 525/625 Categorical Data analysis , Spring 2021 3 SPSS *I set the temporary directory here to make sure temporary files have a legitimate place to go. cd "c:\jason\temp". insert file='C:\Jason\SPSSWIN\macros\ '. execute. process y = w1hheart / x = w1neg / m = w1cesd9 /total=1 /boot=10000 /seed=10000 /model=4 /stand=1. execute. At the bottom of the output, the Indirect effect of X on Y gives the indirect effect and its confidence limits (BootLLCI,BootULCI) using the bootstrap standard error method. Run MATRIX procedure: ** PROCESS Procedure for SPSS Version ** Written by Andrew F.
