Transcription of Methane Pyrolysis for Hydrogen– Opportunities and Challenges
1 Methane Pyrolysis for Hydrogen Opportunities and ChallengesHydrogen Shot SummitThermal Conversion with Carbon Capture & StorageMarc von KeitzProgram Director @ ARPA-EAugust 31, 2021 Methane Pyrolysis How to get to $1/kg of H2?2 H2C (s)CH4 Gaseous hydrogenSolid carbon++750 -1200 C2 Nat Gas Price and Net Hydrogen Yield Drive Cost of H2 Net hydrogen yield is a function of the source of process energy and efficiency stock Cost in $/kg Hydrogen producedNat Gas Price ($/mmBTU)50% Net Hydrogen yield70% Net Hydrogen yield90% Net Hydrogen yieldValorizing the Carbon can reduce Feedstock stock Cost in $/kg Hydrogen producedNat Gas Price ($/mmBTU)
2 50% Net Hydrogen yield50% Net Hydrogen with Carbon revenue70% Net Hydrogen yield70% Net Hydrogen with Carbon revenue90% Net Hydrogen yield90% Net Hydrogen with Carbon revenueThis model assumes revenue of $200/MT of solid carbonMaking a lot of Hydrogen means making a lot of Carbon5 Image: dpa1 Quad of Hydrogen via Methane Pyrolyisalso generates ~32 million MT of solid carbon at 70% net hydrogen yield Which markets can absorb this volume of carbon?6 ARPA-E Methane Pyrolysis Cohort* takes 2-pronged approachValue of CarbonValue of HydrogenARPA-EMetallurgical CokeCNTC arbon FiberLow volume H2 High volume H27C Zero New Carbon Applications* Cohort has been assembled from OPEN 2018 and 2019 FOA projectsMIT Carbon House Carbon-based Composite Buildings8 Stop the Leaks!
3 To realize low/no-carbon hydrogen from Methane (by Methane Pyrolysis , SMR+CCS or other), we need to radically eliminate Methane leaks in the supply chain and in the conversion process 10 Conversion Pathway Panel Methane Pyrolysis Technologies Dane A. Boysen, PhDModular Chemical, 31, 2021 HYDROGEN EARTHSHOT SUMMITHYDROGEN COLORS 3 HYDROGEN SOURCEENERGY SOURCEPRODUCTION PROCESSBY-PRODUCTTONS CO2 PER TON H2 GREEN0 YELLOW+ + + + gasbio-methanerenewable energygrid electricitynuclear energylignite coalbituminous coalelectrolysisthermochemical thermal electrolysisCO2emittedCO2sequesteredsoli d carbon productpure oxygen gaschemical productWHAT IS IT?
4 1/2CH4(g) = H2(g) + 1/2C(s) Thermodynamics rH 298K = + kJ/mol rG 298K= + kJ/mol Favorable reaction above 547 C High conversion above 760 C4 Methane Pyrolysis the thermal breakdown of Methane into hydrogen gas and solid carbon CO2emission-free pathway for making hydrogen from natural abundant Methane (natural gas or biomethane) WHO CARES? Climate Change Primary driver keep global temperature rise below 2 C What it will take must reduce GHG emissions to zero by 2050 Annual energy-related GHG emissions in 2018 Gt CO2 Annual H2-related GHG emissions Gt CO2( ) Carbon intensity 12 t CO2 per t H25 HYDROGEN PRODUCTIONWHO CARES?
5 Climate Change Industrial Hydrogen6 HYDROGEN PRODUCTION76% (53 Mt)23% (16 Mt)2018 Global Hydrogen ProductionSteam Methane ReformingCoal GasificationElectrolysis2% (1 Mt)Iron 33% (23 Mt)27% (19 Mt)11% (8 Mt)2018 Global Hydrogen ConsumptionOil RefiningAmmonia ProductionMethanol3% (2 Mt) 70 Mt H2 Birol F. The Future of Hydrogen: Seizing Today's Opportunities . Report prepared by the IEA for the G20, 82-83, Japan. CARES? Climate Change Industrial Hydrogen Food Security Annual demand to make ammonia 19 Mt H2(27%) Population fed by synthetic ammonia billion (48%)7 HYDROGEN PRODUCTIONE rismanJWet al. Nature Geoscience, 1(10), 636-639.
6 (2008). Low-cost hydrogen supply is critical to the food security of over half of the world s populationWHY IS IT HARD? Slow reaction kinetics Methane = highly symmetric molecule CH3 H bond energy 440 kJ/mol results in difficult C-bond activation8 Younessi-SinakiM, et al. Int. J. Hydrogen Energy 34(9): 3710-3716. (2009) Methane PYROLYSISWHY IS IT HARD? Slow reaction kinetics Carbon formation (g) = H2(g) + (s) Carbon production = 3 tons per ton H2 Good catalysts (Ni, Fe) deactivate quickly Efficient separation is difficult What can we do with all that carbon?9 Methane PYROLYSISWHY IS IT HARD? Slow reaction kinetics Carbon formation Economic disadvantage10 Methane PYROLYSISCoal50 $ $/GJNatural $ $ $ $/GJDescriptionOverall ReactionChemicalThermalt CO2/ t H2$/kg H2 Methane Pyrolysis1/2CH4(g) = H2(g) + 1/2C(s) Gasification1/2C(s) + H2O(l) = H2(g) + 1/2CO2(g)CC+ Methane Reforming1/2CH4(g) + 1/2H2O(l) = H2(g) + 1/2CO2(g)CH4CH4+ ElectrolysisH2O(l) = H2(g) + 1/2O2(g)electricalelectrical0to+ Electricity (US, 2019) lb CO2/kWh (116 kg/GJ)ASSUMED COMMODITY PRICESASSUMED CARBON INTENSITYTHEORETICAL MINIMUMi.
7 Assuming biogas feedstock, ii. assuming electric grid carbon intensityCOMMENT ON ELECTRICITY PRICES Many claim that renewable electricity prices will reach < 3 /kWh While this may be true for a few select, site-specific cases ( , co-location near a hydro-electric power plant) In general, levelized electricity price data for increased renewables penetration do not support these claims11 HOW IS DONE TODAY?12 Methane Pyrolysis FUNDAMENTAL WAYS TO INCREASE KINETICSHOW IS DONE TODAY?13 Methane Pyrolysis DEVELOPMENT HISTORYA daptedfromBode A et al. BASF. ProcessNetJahrestagung. Aachen, Germany. 14 Sep IS DONE TODAY?14 Methane Pyrolysis COMMERCIAL EFFORTS DATABASECOMMENT ON PLASMA & MICROWAVE APPROACHES15 With many new companies doing plasma Methane Pyrolysis .
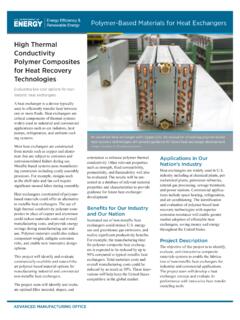
8 It is critical investors look at mass and energy results to validate claimsCompany Data plasma voltage = 50 V plasma current = 260 A Methane flow = 375 L/h Methane conversion = 99%Calculations plasma power = kW Methane feed = kg/h hydrogen out= kg/hEXAMPLEPLASMA COST = $/kg H2 MARKET PRICE = $/kg + Methane PyrolysisTopicsMonolith OverviewHydrogen s Role in the Energy TransitionMonolith s Hydrogen Advantage23 Build the World s Leading Renewable Hydrogen & Clean Materials CompanyVision4 Carbon (C)Hydrogen (H2)Produced(Renewable)Natural Gas (CH4)Protected Methane Pyrolysis TechnologyRenewableElectricityRenewable Hydrogen from Renewable Electricity & Natural GasMonolith is the most sustainable and lowest-cost producer of hydrogen in the world, as its proprietary process unlocks significant value from high performance carbon products and its differentiated go-to-market strategy generates substantial cash flows under both existing and expanding markets Unique Business Plan5 Carbon intensity ( )( )
9 With Carbon CapturePyrolysisElectrolysisPyrolysis with RNGkg CO2e / kg H2 CARBON INTENSITY OF HYDROGEN PRODUCTION WELL TO Hydrogen Analysis (H2A) Production Models, Version , Central SMR without CCUS Hydrogen Analysis (H2A) Production Models, Version , Central SMR with on third party study using GREET1_2020 and AR5 GWP (CO2, N20, CH4) Hydrogen Analysis (H2A) Production Models, Version , Central Electrolysis (Process emissions only) on third party study using GREET1_2020 and AR5 GWP (CO2, N20, CH4) Notes:1. Electrolysis and Pyrolysis assume 100% renewable electricityGreyBlueGreen6 Commercial ScaleTechnology proven (demonstration scale)Monolith founded and IP acquiredStage 1: Development Stage 2: Commercial LaunchStage 3: Market Expansion20172013 Monolith is founded in Palo Alto, California and builds its pilot plant in the San francisco Bay onlineTechnology proven(commercial scale)2025+ seaport , CaliforniaCommissioned: 2014 Olive Creek I (OC1), NebraskaCommissioned: 2020 Olive Creek II (OC2), NebraskaCommissioned.
10 2024 (planned)2021OC2online Plant 3online seaport pilot facility successfully demonstrates Monolith s core technology at demonstration scale over a 4-year R&D facility is completed and successfully demonstrates Monolith s core technology at commercial facility comes online as the largest Methane Pyrolysis plant in the R&D at Monolith s laboratory in Lincoln, tech office in California, and pilot plant in FranceMonolith replicates existing technology to build operated and licensed future is 8 years into a 15 year business plan to become the worlds leading clean hydrogen producerHydrogen s Role in the Energy Transition8 Hydrogen s Diverse Set of Potential Use CasesHydrogen is a $100+ billion market today and projected to reach $ + trillion by 2050H2 FuelHeatFeedstockTransportationPowerIndu stryBuildingsChemicalsMaterialsSource.