Transcription of Methanex Investor Presentation
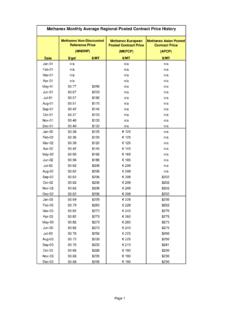
1 1 Methanex Investor PresentationJune 201622 Forward looking Statements & Non GAAP MeasuresInformation contained in these materials or presented orally on the earnings conference call, either in prepared remarks or in response to questions, contains forward looking statements. Actual results could differ materially from those contemplated by the forward looking statements. For more information, we direct you to our 2015 Annual MD&A and our first quarter 2016 MD&A, as well as slide 31 of this Presentation . This Presentation also contains certain non GAAP financial measures that do not have any standardized meaning and therefore are unlikely to be comparable to similar measures presented by other companies.
2 For more information regarding these non GAAP measures, please see our 2015 Annual MD&A and our first quarter 2016 MD&A. 33 Methanex Investment OpportunityGlobal Methanol Leader Leading market share Competitive assetsStrong Cash Flow Generation & Distributions Solid growth in cash generation capability ~47% of shares bought back since 2000 Dividend raised 11 times since implemented 2002; $ Long term Industry Outlook Healthy demand growth outlook Limited new supplyGrowthPotential Production: Chile Market: Demand growth into energy applications & MTO Value Trading at a significant discount to replacement cost44 Investment Opportunity.
3 Upside Leverage, Downside Protection60% capacity growth in 3 years Three million tonnes in capacity additions over last three years New capacity growth positioned in OECD countries, reducing riskResponsive cost structure Gas contract structure reduces costs at low methanol prices Shipping costs benefit from lower fuel prices Flexible global supply chain allows agility in serving customersStrong demand upside at higher methanol prices Approx. six million tonnes annualized latent demand in Q1, 2016. Estimated 7% CAGR over next four years with upside potential athigher methanol pricesMethanol cost curve serves as floor Current China spot methanol pricing estimated to be consistent with marginal cash cost Strong Liquidity Position Strong balance sheet Limited near term commitments for cash Undrawn $300 million credit facility55 Industry Overview ~62 million tonnes annual global demand1 Top producers account for ~ half of global sales Next largest competitors are not materially expanding their methanol investments in the near term Methanex is the global leader ~14% market share2 Unique global position with sales in
4 All major regionsSource: Methanex1 Estimated annualized demand as at Q1, 2016 (excluding integrated methanol to olefins (MTO) demand). Source: Methanex2 global market share is Methanex s share of total methanol sales excluding methanol consumed by integrated MTO producers. Source: Methanex66 Industry OverviewMethanol End Uses77010,00020,00030,00040,00050,00060, 00070,00080,00090,000100,0002005 2006 2007 2008 2009 2010 2011 2012 2013 2014 2015 2016E 2017E 2018E 2019 EChemicalMTBE/TAMEFuelDMEMTO/MTP (Merchant)Industry Overview Strong Demand Growth Projected 7% CAGR (20 million tonnes over four years), led by MTO(000s tonnes)2006 2015 CAGR: 7%2016 2019 CAGR: 7%Source: IHS Chemical, Chemical Supply and Demand Balance 2016.
5 Excludes integrated methanoldemand for methanol to olefins and propylene. 88 Industry OverviewDemand / Supply Balance Demand expected to outpace new supply Expect MTO operating rates will depend on methanol affordability Supply gap expected to be closed through higher operating rates for existing higher cost China plants, or lower demandSources: Demand IHS Chemical, Chemical Supply and Demand Balance Update 2016 . Excludes demand from upstream integrated coal to olefins plants. Capacity Methanex . Other is net of expected shut ins outside China of approximately million tonnes. Iran N. America (net) ReviewReinvestment EconomicsKey Assumptions: Replacement cost of $1,100/tonne based on published estimates for the OCI million MT Natgasoline project and G2X Lake Charles million MT plant.
6 Maintenance capital $10 million/yr, freight $80/tonne (US to Asia), 30% tax rate, 2% inflationSource: Methanex Today new North America supply additions are challenged by: Methanol price outlook vs return requirements Capital cost pressure and uncertainty Increased economic risk on key variables (capital, gas) Several projects under discussion, but limited committed capital Natural gas$ Methanol Price $/tonneEstimated Nominal IRR at Alternative Methanol and Gas Prices1010 Coastal China, Russia Exports, E. Europe, Netherlands, India,Other South AmericaMethanol Industry Cost Curve Cost curve remains steep at the high end, but has flattened in the mid range in the current lower energy price environment High end set today primarily by China coal based production, some natural gas Source: Methanex Inland China Coal, New Zealand, SE Asia, North America, Trinidad, Africa, Middle East, Venezuela 1111 Energy ApplicationsMethanol value propositionSource.
7 Historical annual data and forecast from IHS Chemical, May, 2016 Methanol is primarily made from natural gas, and is a liquid fuel and oil product alternative High priced oil versus natural gas creates substitution incentive Energy applications emerged post 2008 when the ratio of oil $/bbl and natural gas $/mmbtu prices exceeded 15:11212 Methanol to Olefins (MTO) / Methanol to Propylene (MTP) MTO an alternative process to Naptha cracking for olefins production (plastics) Two main pathways Upstream Integrated (CTO) olefins produced directly from coal, methanol an intermediate step Merchant (MTO/MTP) methanol purchased from external suppliers China merchant MTO capacity is well established and still growing stronglyEthylene Oxides (EO)MEGA crylic Acid (AA)
8 ACNP ropylene OxidePESynthesisGas ProductionMethanolProductionMethanol toOlefinsNatural Gas CoalPetroleum ResiduesHigh PurityEthyleneHigh PurityPropyleneNingbo Skyford s MMT merchant methanol to MMT olefins plant 1313 MTO Demand Leading Growth 13 merchant plants today, potential methanol demand over 12 million MT 4 more plants under construction expected to start up in 2016, incremental demand potential over million MT 2015 combined MTO/MTP operating rate approximately 60%, or 70% excl. MTPE stimatedStart upNumber of PlantsMethanol Demand Capacity* (million MT)Completed : MethanexNanjing Wison s MMT merchant methanol to MMT olefins plant *Capacity at 100% operating rates1414 Sustaining Methanol Demand Growth into MTO MTO leading methanol demand growth with upside potential based on installed capacity Methanol demand from MTO is poised to grow upon olefin price recoveryActual and Potential* Methanol Demand (Annualized)
9 * Potential demand based on assumption of a 90% operating rate for MTO and 70% for MTP1515 Energy ApplicationsChina Fuel Demand Growth Expected to ContinueProvinceLocal MethanolGasoline StandardsImplementedSinceGansuM15 & M302009 Guizhou M152010 HebeiM15 & M302010 HeilongjiangM152005 JiangsuM452009 LiaoningM152006 ShaanxiM15 & M252004 ShandongM152012 ShanghaiM1002013 ShanxiM5, M15, M85 & M1002008 SichuanM102004 XinjiangM15 & M302007 ZhejiangM15, M30 & M502009 NingxiaM15 & M3020141616 Emerging MarketsMarine Fuel Industry Transitioning to Cleaner Fuels 100,000+ commercial vessels in the world today operating on Heavy Fuel Oil (HFO)*, which is high in sulphur.
10 Methanol is sulphur free. N. Europe and N. America reduced allowable limited sulphur emissions to starting January 2015 which precludes HFO. IMO targeting all marine fuels to be less than sulphurglobally by 2020. 40 MMTPA methanol equivalent market in Northern Europe Sulphur Emissions Control Area Emissions Control AreaPotential future Emissions Control AreaSource: FCBI Energy Report on Methanol as a Marine Fuel See Marine Fuel Developments Waterfront Shipping launching seven new 50,000 dwt vessels with methanol dual fuel MAN 2 stroke engines First three vessels delivered in April 16, next four to be delivered over next few months Stena Line converted Germanica ferry to run on methanol in 2015 Germanica is using Wartsila 4 stroke enginesStena Line s first methanol powered ferryOne of Waterfront s first methanol powered vessels1818 MethanexProduction CapacityChileTrinidadUSA (Geismar)*New ZealandCanada (Medicine Hat)