Transcription of Method - P-S Logging - GEOVision
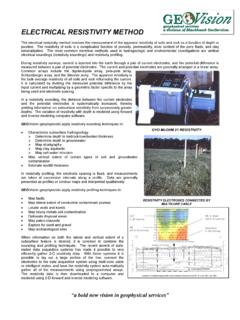
1 A bold new vision in geophysical services Cable HeadHead ReducerUpper GeophoneLower GeophoneFilter TubeSourceSource DriverWeightWinch7-Conductor cableDiskettewith DataOYO PS-160 Logger/RecorderOverall Length ~ 25 ftSUSPENSION P-S VELOCITY Logging Method Overview Suspension P-S velocity Logging is a relatively new Method of measuring seismic wave velocity profiles. Developed in the mid-1970s to answer the need for a technique that could measure seismic shear-wave velocities in deep, uncased boreholes, it was originally used by researchers at the OYO Corporation of Japan. The Method gained acceptance in Japan in the mid-1980s and was used with other velocity measurement methods to characterize earthquake site response.
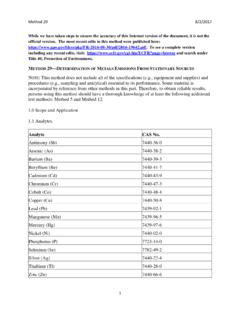
2 Since the early 1990s it has gained acceptance in the , especially among earthquake engineering researchers. GEOV ision personnel have logged over 300 boreholes using this technique since 1991. Procedure The OYO P-S Logging System uses a 7-meter probe, containing a source and two receivers spaced 1 meter apart, suspended by a cable. The armored 4- or 7-conductor cable serves both to support the probe and to convey data to and from a recording/control device on the surface. The probe is lowered into the borehole to a specified depth (a rotary encoder on the winch measures probe depth), where the source generates a pressure wave in the borehole fluid.
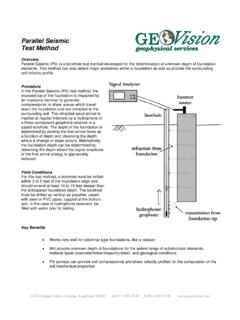
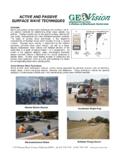
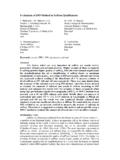
3 The pressure wave is converted to seismic waves (P and S) at the borehole wall. Along the wall at each receiver location, the P and S waves are converted back to pressure waves in the fluid and received by the geophones, which send the data to the recorder on the surface. The elapsed time between arrivals of the waves at the receivers is used to determine the average velocity of a 1-meter-high column of soil around the borehole. Source to receiver analysis is also performed for quality assurance. Oyo PS Suspension Logger Setup Oyo PS Suspension Logging System Waveform Data for a Single Measurement 1151 Pomona Road, Unit P, Corona, California 92882, ph. 909-549-1234, fx. 909-549-1236, 05000100001500020000 Velocity, ft/sec5004003002001000 Depth, ft S-WaveP-WaveSuggested layervelocitiesGOLDEN GATE BRIDGE HOLE B6 SUSPENSION LOGGINGP and S Wave Velocities; Data collected December 14-15, 19911800 2800 3400 5800 6600 7400 6300 8200 4800 7200 9300 12400 12000 13000 11000 15000 Depth Sequential Waveform Arrivals Applications Typical applications of suspension P- and S-wave velocity Logging include: Dam safety investigations Seismic site response studies for bridge abutments, dams, buildings, etc.
4 Foundation studies Measurement of soil/rock properties ( shear modulus, bulk modulus, compressibility, and Poisson s ratio) Characterization of strong motion sites Velocity control for seismic reflection surveys Key Benefits Suspension P- and S-wave velocity profiling using the OYO Suspension Logger has become the Method of choice for obtaining high resolution borehole velocity measurements. The reasons are many: Only Method that obtains both P- and S-wave velocity data reliably in a single hole at depths greater than 200 ft. Can be used in either uncased or cased (PVC) boreholes, although results are always better in uncased holes. Can be used in boreholes drilled from barges.
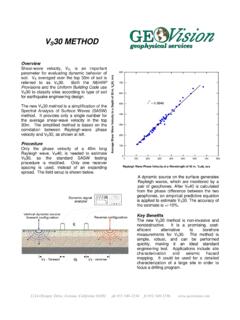
5 Offers very high resolution (typically 1 meter) for resolving thin layers that can have a dramatic effect on surface response. Requires only 1 hole, as opposed to crosshole methods that require at least 2. Has been used to depths of 2,000 ft. Specifically adapted to soils, whereas tools developed for oil exploration are optimized for rock. Permits measurement of soil and rock properties such as shear modulus, bulk modulus, compressibility, and Poisson s ratio. Not hindered by fast layers and lack of depth penetration like surface methods such as downhole. 0200040006000800010000120001400016000180 00 VELOCITY, FEET/SEC400350300250200150100500 DEPTH, FEETR1-R2 S-WAVER1-R2 P-WAVETREASURE ISLAND BOREHOLE USN-1 SUSPENSION LOGGINGP- AND S-WAVE VELOCITIES; DATA COLLECTED OCTOBER 13, 1994