Transcription of Methodological Analysis of Principal Component Analysis ...
1 IJCEM International Journal of Computational Engineering & Management, Vol. 16 Issue 2, March 2013 ISSN (Online): 2230-7893 IJCEM 32 Methodological Analysis of Principal Component Analysis (PCA) Method Liton Chandra Paul1, Abdulla Al Suman2, Nahid Sultan3 1,2,3 Department of Electronics & Telecommunication Engineering, Rajshahi University of Engineering & Technology, Rajshahi-6204, Bangladesh. Abstract Principal Components Analysis (PCA) is a practical and standard statistical tool in modern data Analysis that has found application in different areas such as face recognition, image compression and neuroscience. It has been called one of the most precious results from applied linear algebra. PCA is a straightforward, non-parametric method for extracting pertinent information from confusing data sets.
2 It presents a roadmap for how to reduce a complex data set to a lower dimension to disclose the hidden, simplified structures that often underlie it. This paper mainly addresses the Methodological Analysis of Principal Component Analysis (PCA) Method. PCA is a statistical approach used for reducing the number of variables which is most widely used in face recognition. In PCA, every image in the training set is represented as a linear combination of weighted eigenvectors called eigenfaces. These eigenvectors are obtained from covariance matrix of a training image set. The weights are found out after selecting a set of most relevant Eigenfaces. Recognition is performed by projecting a test image onto the subspace spanned by the eigenfaces and then classification is done by measuring minimum Euclidean distance.
3 In this paper we present a comprehensive discussion of PCA and also simulate it on some data sets using MATLAB. KEYWORDS: Principal Component , Covariance matrix, Eigenvalue, Eigenvector, PCA. Introduction Principal Component Analysis is also called Hotteling transform or Karhunen-leove (KL) Method . Principle Component Analysis (PCA) is one of the most frequently used multivariate data Analysis . Principle Component Analysis can be considered as a projection method which projects observations from a p-dimensional space with p variables to a k-dimensional space (where k < p) so as to conserve the maximum amount of information (information is measured here through the total variance of the scatter plots) from the initial dimensions.
4 If the information associated with the first 2 or 3 axes represents a sufficient percentage of the total variability of the scatter plot, the observations will be able to be represented on a 2- 3-dimensional chart, thus making interpretation much easier [1]. Principal Component Analysis (PCA) involves a mathematical procedure that transforms a number of (possibly) correlated variables into a (smaller) number of uncorrelated variables called Principal components. The first Principal Component accounts for as much of the variability in the data as possible and each succeeding Component accounts for as much of the remaining variability as possible [2]. 2. Objectives of Principal Component Analysis To discover or to reduce the dimensionality of the data set.
5 To identify new meaningful underlying variables. The mathematical technique used in PCA is called eigen Analysis : we solve for the eigenvalues and eigenvectors of a square symmetric matrix with sums of squares and cross products. The eigenvector associated with the largest eigenvalue has the same direction as the first Principal Component . The eigenvector associated with the second largest eigenvalue determines the direction of the second Principal Component . The sum of the eigenvalues equals the trace of the square matrix and the maximum number of eigenvectors equals the number of rows (or columns) of this matrix [2]. 3. Characteristics of Principal Components The first Component extracted in a Principal Component Analysis accounts for a maximal amount of total variance in the observed variables.
6 Under typical conditions, this means that the first Component will be correlated with at least some of the observed variables. It may be correlated with many. The second Component extracted will have two important characteristics. First, this Component will account for a maximal amount of variance in the data set that was not accounted for by the first Component . Again under typical conditions, this means that the second Component will be correlated with some of the observed variables that did not display strong correlations with Component 1. The second characteristic of the second Component is that it will be uncorrelated with the first Component . Literally, if you were to compute the correlation between components 1 and 2, that correlation would be zero.
7 The remaining components that are extracted in the Analysis display the same two characteristics: each Component accounts for a maximal amount of variance in the observed variables that was not accounted for by the preceding components, and is uncorrelated with all of the preceding components. A Principal Component Analysis proceeds in this fashion, with each new Component accounting for progressively smaller and smaller amounts of variance (this is why only the first few components are usually retained and interpreted). When the Analysis is complete, the resulting components will display varying degrees of correlation with the observed variables, but are completely uncorrelated with one another [3].
8 4. Principal Component Analysis Is Not Factor Analysis Principal Component Analysis is sometimes confused with factor Analysis and this is understandable, because there are many important similarities between the two procedures. IJCEM International Journal of Computational Engineering & Management, Vol. 16 Issue 2, March 2013 ISSN (Online): 2230-7893 IJCEM 33 Both are variable reduction methods that can be used to identify groups of observed variables that tend to hang together empirically. Both procedures can be performed with the SAS System s FACTOR procedure and they sometimes even provide very similar results. Nonetheless, there are some important conceptual differences between Principal Component Analysis and factor Analysis that should be understood at the outset.
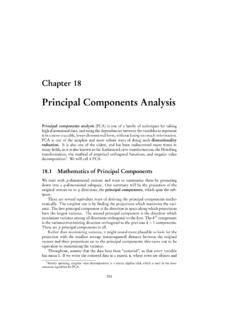
9 Perhaps the most important deals with the assumption of an underlying causal structure: factor Analysis assumes that the co-variation in the observed variables is due to the presence of one or more latent variables (factors) that exert causal influence on these observed variables. An example of such a causal structure is presented in Figure The ovals in Figure 1 represent the latent (unmeasured) factors of satisfaction with Supervision and satisfaction with pay. These factors are latent in the sense that they are assumed to actually exist in the employee s belief systems, but cannot be measured directly. However, they do exert an influence on the employee s responses to the seven items that constitute the job satisfaction questionnaire described earlier (these seven items are represented as the squares labelled V1-V7 in the figure).
10 It can be seen that the supervision factor exerts influence on items V1-V4 (the supervision questions), while the pay factor exerts influence on items V5-V7 (the pay items). Figure-1: Example of the Underlying Causal Structure that is assumed in Factor Analysis Researchers use factor Analysis when they believe that certain latent factors exist that exert causal influence on the observed variables they are studying. Exploratory factor Analysis helps the researcher identify the number and nature of these latent factors. In contrast, Principal Component Analysis makes no assumption about an underlying causal model. Principal Component Analysis is simply a variable reduction procedure that (typically) results in a relatively small number of components that account for most of the variance in a set of observed variables [3].