Transcription of Metropolitan Area Employment and Unemployment - January …
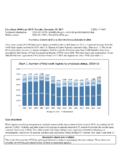
1 For release 10:00 (EST) Tuesday, February 6, 2018 USDL-18-0205 Technical information: Employment : (202) 691-6559 Unemployment : (202) 691-6392 Media contact: (202) 691-5902 Metropolitan AREA Employment AND Unemployment DECEMBER 2017 Unemployment rates were lower in December than a year earlier in 314 of the 388 Metropolitan areas, higher in 61 areas, and unchanged in 13 areas, the Bureau of Labor Statistics reported today. Seventy-one areas had jobless rates of less than percent and four areas had rates of at least percent. Nonfarm payroll Employment increased over the year in 316 Metropolitan areas, decreased in 60 areas, and was unchanged in 12 areas. The national Unemployment rate in December was percent, not seasonally adjusted, down from percent a year earlier.
2 Metropolitan Area Unemployment (Not Seasonally Adjusted) In December, Ames, IA, had the lowest Unemployment rate, percent, followed by Urban Honolulu, HI, percent. El Centro, CA, and Yuma, AZ, had the highest Unemployment rates, percent and percent, respectively. A total of 190 areas had December jobless rates below the rate of percent, 183 areas had rates above it, and 15 areas had rates equal to that of the nation. (See table 1 and map 1.) El Centro, CA, had the largest over-the-year Unemployment rate decrease in December ( percentage points). An additional 120 areas had rate declines of at least percentage point. The largest over-the-year rate increase occurred in Fairbanks, AK (+ percentage point).
3 Of the 51 Metropolitan areas with a 2010 Census population of 1 million or more, Nashville-Davidson Murfreesboro Franklin, TN, had the lowest Unemployment rate in December, percent. Buffalo-Cheektowaga-Niagara Falls, NY, had the highest jobless rate among the large areas, percent. Forty-four large areas had over-the-year Unemployment rate decreases, six had increases, and one had no change. The largest rate decrease occurred in Birmingham-Hoover, AL ( percentage points). The largest over-the-year rate increase was in Buffalo-Cheektowaga-Niagara Falls, NY (+ percentage point). Metropolitan Division Unemployment (Not Seasonally Adjusted) Eleven of the most populous Metropolitan areas are made up of 38 Metropolitan divisions, which are essentially separately identifiable Employment centers.
4 In December, San Francisco-Redwood City-South San Francisco, CA, had the lowest Unemployment rate among the divisions, percent, closely -2- followed by San Rafael, CA, percent. Tacoma-Lakewood, WA, had the highest division rate, percent. (See table 2.) In December, 22 Metropolitan divisions had over-the-year Unemployment rate decreases, 12 had increases, and 4 had no change. The largest rate declines occurred in Elgin, IL; Gary, IN; and Lake County-Kenosha County, IL-WI ( percentage points each). The largest over-the-year jobless rate increase occurred in Lawrence-Methuen Town-Salem, MA-NH (+ percentage point). Metropolitan Area Nonfarm Employment (Not Seasonally Adjusted) In December, 316 Metropolitan areas had over-the-year increases in nonfarm payroll Employment , 60 had decreases, and 12 had no change.
5 The largest over-the-year Employment increases occurred in Dallas-Fort Worth-Arlington, TX (+91,700), New York-Newark-Jersey City, NY-NJ-PA (+83,600), and Los Angeles-Long Beach-Anaheim, CA (+78,300). The largest over-the-year percentage gains in Employment occurred in St. George, UT (+ percent), Elkhart-Goshen, IN (+ percent), and Athens-Clarke County, GA (+ percent). (See table 3 and map 2.) The largest over-the-year decrease in Employment occurred in Virginia Beach-Norfolk-Newport News, VA-NC (-7,100), followed by Buffalo-Cheektowaga-Niagara Falls, NY (-4,600), and Rochester, NY (-3,500). The largest over-the-year percentage decrease in Employment occurred in Cape Girardeau, MO-IL ( percent), followed by Grand Forks, ND-MN ( percent), and Elmira, NY, and Michigan City-La Porte, IN ( percent each).
6 Over the year, nonfarm Employment rose in 47 of the 51 Metropolitan areas with a 2010 Census population of 1 million or more and fell in 4. The largest over-the-year percentage increases in Employment in these large Metropolitan areas occurred in Orlando-Kissimmee-Sanford, FL (+ percent), Riverside-San Bernardino-Ontario, CA (+ percent), and San Antonio-New Braunfels, TX (+ percent). The over-the-year percentage decreases occurred in Virginia Beach-Norfolk-Newport News, VA-NC ( percent), Buffalo-Cheektowaga-Niagara Falls, NY ( percent), Rochester, NY ( percent), and New Orleans-Metairie, LA ( percent). Metropolitan Division Nonfarm Employment (Not Seasonally Adjusted) In December, nonfarm payroll Employment increased in 36 of the 38 Metropolitan divisions over the year and fell in 2.
7 The largest over-the-year increase in Employment among the Metropolitan divisions occurred in New York-Jersey City-White Plains, NY-NJ (+84,200), followed by Dallas-Plano-Irving, TX (+61,800), and Los Angeles-Long Beach-Glendale, CA (+54,700). The over-the-year decreases occurred in Newark, NJ-PA (-9,300), and Gary, IN (-7,100). (See table 4.) The largest over-the-year percentage increases occurred in Haverhill-Newburyport-Amesbury Town, MA-NH, and Tacoma-Lakewood, WA (+ percent each), followed by Miami-Miami Beach-Kendall, FL (+ percent). The over-the-year percentage decreases occurred in Gary, IN ( percent), and Newark, NJ-PA ( percent). _____ The Regional and State Unemployment 2017 Annual Averages news release is scheduled to be released on Tuesday, February 27, 2018, at 10:00 (EST).
8 The State Employment and Unemployment news release for January 2018 is scheduled to be released on Monday, March 12, -3- 2018, at 10:00 (EDT). The Metropolitan Area Employment and Unemployment news release for January 2018 is scheduled to be released on Friday, March 16, 2018, at 10:00 (EDT). Upcoming Changes to Local Area Unemployment Statistics Data Effective with the release of Regional and State Unemployment 2017 Annual Averages on Tuesday, February 27, 2018, the civilian labor force and Unemployment data for census regions and divisions and all states, the District of Columbia, and the modeled substate areas presented in tables 1 and 2 of this news release will be revised from 2013 to 2017 to incorporate updated inputs, new population controls, and reestimation of models.
9 Civilian labor force and Unemployment estimates for all other Metropolitan areas and Metropolitan divisions subsequently will be revised to reflect updated inputs and adjustment to the new statewide estimates. These revised estimates will be published in conjunction with the March 2018 State Employment and Unemployment news release on Friday, April 20, 2018. Upcoming Changes to Current Employment Statistics Data Effective with the release of January 2018 estimates on March 12, 2018, all nonfarm payroll Employment estimates for states and areas presented in tables 3 and 4 of this news release will be adjusted to 2017 benchmark levels. Also effective with the release of January 2018 estimates, the Current Employment Statistics (CES) program will convert to concurrent seasonal adjustment, which uses all available estimates, including those for the current month, in developing seasonal factors.
10 Currently, the CES program develops seasonal factors once a year during the annual benchmark process. For more information on concurrent seasonal adjustment in the CES State and Area program, see Not seasonally adjusted data beginning with April 2016 and seasonally adjusted data beginning with January 2013 are subject to revision. Some seasonally adjusted series may be revised back to 1990. Conversion to the 2017 North American Industry Classification System With the release of January 2018 data on March 12, 2018, the Current Employment Statistics (CES) survey will revise the basis for industry classification from the 2012 North American Industry Classification System (NAICS) to the 2017 NAICS for all states and Metropolitan areas.
