Transcription of MI COVID response
1 November 30, 2021MI COVID responseData and modeling updateExecutive SummaryMichigan remains atHigh TransmissionPercent positivity( )is increasing (up from % last week) case rate( cases/million) is increasing forone month ( cases/million prior week)In the last 7 days, Michigan reported the second most cases and case rate ( case Count this week rank: 2ndhighest; last week s rank: highest) ( case Rate this week rank: 2ndhighest; last week s rank: highest)Cases among pediatric populations < 12 years have increased since last weekPercent of inpatient beds occupied by individuals with COVID ( ) isincreasing for 18 weeks (up from last week)In the last 7 days, no other state or territory has reported a higher inpatient bed utilization than Michigan (last week.)
2 Highest) and 7thhighest adult ICU bed utilization (6thhighest last week)Daily pediatric hospital census are slightly decreased from last week but are near 2021 highsDeath rate( deaths/million) is increasing for one week ( last week).Therewere 439 COVID deaths between Nov 16-Nov 22 Michigan has the 6thhighestnumber of deaths (8thhighest last week), and 14thhighest death rate (24thhighest last week) in the last 7 days7-day average state testing rateis 3, tests/ diagnostic tests (PCR) is per day, and the weekly average for PCR and antigen tests conducted in Michigan is million COVID -19 vaccinedoses administered, of the population is fully vaccinated ( million people)
3 124,810 administrations in 5- to 11-year-olds as of 11/30 SCIENCE ROUNDUPA new variant, Omicron, has been identifiedHealthcare system is expected to be greatly challenged, including increased influenza transmission this winterTools to control community spread, including against variants, will protect vulnerable, and prevent disruptions: Vaccinate, Mask, Test, and Antivirals Global, National and Michigan TrendsGlobally, 261,664,156 cases and 5,202,942 deaths (Data* through 11/29/2021) European case rates are increasing rapidly; & several European countries introduced mitigation measures for unvaccinated individuals (Greece, Germany, Italy, Austria) United States: Nearly all US jurisdictions have High or Substantial community transmission The is at High transmission level (156cases/100,000 in last 7 days).
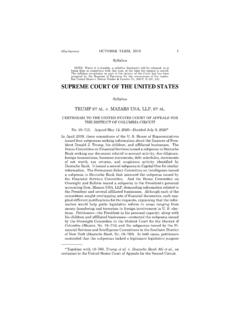
4 Metrics are underestimates as reporting lags nationwide over the Thanksgiving holidayMidwest states maintain High transmission levels and are increasing Michigan has the 2ndhighest case rate in MidwestGlobal and National TrendsSource: * Johns Hopkins Coronavirus Resource Center; CDC COVID Data Tracker Weekly Review; CDC COVID Data Tracker CDC recently updated their methodology for reporting case rates Science Roundup OtherIndicatorsPublic Health ResponseSeveritySpreadNational ComparisonSpecial Populations0204060801007 /18 /19 /110/111/17-day Rol l i ng Avg Ne w case s pe r 100,000 Daily new cases of COVID -19, reported to CDC in Region 5 StatesSeven-day moving average per 100,000 IllinoisIndianaM ic hi ganMinnesotaOhioWisconsinUnited StatesMay 1, 20 Aug 1, 20 Nov 1, 20 Feb 1, 21 May 1, 21 Aug 1, 21 Nov 1.
5 2105001000 Ohio Confirmed New Cases / 1M (7 days average)May 1, 20 Aug 1, 20 Nov 1, 20 Feb 1, 21 May 1, 21 Aug 1, 21 Nov 1, 21-5000200400304 May 1, 20 Aug 1, 20 Nov 1, 20 Feb 1, 21 May 1, 21 Aug 1, 21 Nov 1, 1, 20 Aug 1, 20 Nov 1, 20 Feb 1, 21 May 1, 21 Aug 1, 21 Nov 1, 2105001000 Indiana Confirmed New Cases / 1M (7 days average)May 1, 20 Aug 1, 20 Nov 1, 20 Feb 1, 21 May 1, 21 Aug 1, 21 Nov 1, 1, 20 Aug 1, 20 Nov 1, 20 Feb 1, 21 May 1, 21 Aug 1, 21 Nov 1, 21-5000200400267 Percent Positive (7 day average)Mobility retails and recreationalHospitalizations / 1 MNew TestsNew TestsPercent Positive (7 day average)Mobility retails and recreationalHospitalizations / 1 MState Comparisons.
6 Ohio and Indiana5 May 1, 20 Aug 1, 20 Nov 1, 20 Feb 1, 21 May 1, 21 Aug 1, 21 Nov 1, 2105001000 Wisconsin Confirmed New Cases / 1M (7 days average)May 1, 20 Aug 1, 20 Nov 1, 20 Feb 1, 21 May 1, 21 Aug 1, 21 Nov 1, 21-500100200300400252 May 1, 20 Aug 1, 20 Nov 1, 20 Feb 1, 21 May 1, 21 Aug 1, 21 Nov 1, 1, 20 Aug 1, 20 Nov 1, 20 Feb 1, 21 May 1, 21 Aug 1, 21 Nov 1, 2105001000 Michigan Confirmed New Cases / 1M (7 days average)May 1, 20 Aug 1, 20 Nov 1, 20 Feb 1, 21 May 1, 21 Aug 1, 21 Nov 1, 1, 20 Aug 1, 20 Nov 1, 20 Feb 1, 21 May 1, 21 Aug 1, 21 Nov 1, 21-100-5000200400402 Percent Positive (7 day average)Mobility retails and recreationalHospitalizations / 1 MNew TestsNew TestsPercent Positive (7 day average)Mobility retails and recreationalHospitalizations / 1 MState Comparisons.
7 Wisconsin and Michigan6 May 1, 20 Aug 1, 20 Nov 1, 20 Feb 1, 21 May 1, 21 Aug 1, 21 Nov 1, 2105001000 Illinois Confirmed New Cases / 1M (7 days average)May 1, 20 Aug 1, 20 Nov 1, 20 Feb 1, 21 May 1, 21 Aug 1, 21 Nov 1, 21-500100200300400154 May 1, 20 Aug 1, 20 Nov 1, 20 Feb 1, 21 May 1, 21 Aug 1, 21 Nov 1, 1, 20 Aug 1, 20 Nov 1, 20 Feb 1, 21 May 1, 21 Aug 1, 21 Nov 1, 2105001000 Minnesota Confirmed New Cases / 1M (7 days average)May 1, 20 Aug 1, 20 Nov 1, 20 Feb 1, 21 May 1, 21 Aug 1, 21 Nov 1, 1, 20 Aug 1, 20 Nov 1, 20 Feb 1, 21 May 1, 21 Aug 1, 21 Nov 1, 21-100-5000100200300259 Percent Positive (7 day average)Mobility retails and recreationalHospitalizations / 1 MNew TestsNew TestsPercent Positive (7 day average)Mobility retails and recreationalHospitalizations / 1 MState Comparisons: Illinois and Minnesota7 Key Messages.
8 All COVID -19 Transmission Metrics IncreasingMichigan continues above the High Transmission level All counties in Michigan are at High transmission level CDC recommends all individuals, regardless of vaccination status, should mask indoorsStatewide positivity is (last week: %) The trend is increasing for 5 weeks Positivity is increasing in 4 MERC regions (Regions Detroit, Kalamazoo, Saginaw, and Upper Peninsula) Positivity in all regions is above 15% and four regions are above 20% case rate has increased to cases/million (last week: cases/million).
9 Reported cases per million are delayed due to Thanksgiving holidays Cases per million are increasing among most age groups In the past 7 days, 30-39-years-olds are experiencing the highest number of cases ( daily cases), and highest case rate ( cases/mil) Approximately of people who were fully vaccinated have been reported with a breakthrough infectionCases and outbreaks increasing in the long-term care settingScience Roundup OtherIndicatorsPublic Health ResponseSeveritySpreadNational ComparisonSpecial Populations9 Michigan experiencing highest daily case count of pandemicDashboard | CDC | MI Start Mapfor most recent data by reporting dateScience Roundup OtherIndicatorsPublic Health ResponseSeveritySpreadNational ComparisonSpecial Populations Referrals declined over the
10 Holiday weekend10 Confirmed and probable case indicatorsTable Date: 11/29/2021 (7 days from date table was produced: 11/22/2021)Risk levelsLowABCDEC asesPositivityScience Roundup OtherIndicatorsPublic Health ResponseSeveritySpreadNational ComparisonSpecial PopulationsOverview of metrics for individuals < 12 and <18 Each day more than 866 children under age 12 become infected with COVID -19, 22 more than last week Pediatric case rates increased to cases/million (last week: cases/million) Pediatric (<18) hospital census* is averaging approximately 47 per day (last week: 49 per day)Note: Data as of 11/15; case data 11/8, hospitalization data 11/15.