Transcription of MICRO ENTERPRISES THE CASE OF SS FARMERS IN ARUSHA …
1 STRENGTHENING MICRO ENTERPRISES IN TANZANIA: THE CASE OF SMALL SCALE VEGETABLE FARMERS IN ARUSHA final REPORT Economic and Social Research Foundation (ESRF) April 2010 1 TABLE OF CONTENTS 1 THE BACKDROP .. 5 Objectives of the 6 The Methodology .. 7 Organization of the Research Report .. 8 2 INCOME AND EMPLOYMENT POTENTIAL OF SMALL SCALE HORTICULTURE PRODUCTION .. 8 3 SOCIAL ECONOMIC CHARACTERISTICS OF THE SURVEYED SMALL SCALE FARMERS IN ARUSHA .. 9 General Characteristics of Smallholder Horticultural FARMERS .. 9 Main Source of Income and Participation of Family Labour in Farming Activities.
2 11 Types of Crops Grown .. 12 Financing of Farming Activities .. 13 Marketing Methods .. 16 Supply Chain .. 17 4 CONSTRAINTS IN FARMING AND MARKETING ACTIVITIES .. 18 Extension Services and Quality .. 20 Ability to Meet Needs of Buyers .. 21 Existence of Processing Firms and Potential for Increasing Production of Horticultural Products .. 23 Opportunities to Export .. 25 Growth and Expansion .. 27 5 DETERMINANTS OF PROFITABILITY .. 28 6 CONCLUDING DISCUSSION .. 30 7 LIMITATIONS OF THE STUDY .. 30 APPENDIX .. 33 2 LIST OF TABLES Table 1: Summary of Demographic and Education Characteristics.
3 10 Table 2: Where Farm Implements are Hired or Borrowed From .. 10 Table 3: Main Horticultural Vegetables 12 Table 4: Other Crops Grown .. 13 Table 5: Main Source of Start up Capital .. 13 Table 6: Other Sources of Start Up Capital .. 14 Table 7: Ownership of Bank Account .. 14 Table 8: Reasons for Not Owning a Bank Account .. 15 Table 9: Where they Usually Borrow Money From .. 15 Table 10: Main Buyers of Produce .. 16 Table 11: Main Marketing Methods .. 17 Table 12: Types of Inputs used .. 19 Table 13: Existence of Extension Services .. 20 Table 14:Reasons for the Failure to Meet the Buyers' Requirements by 22 Table 15: Descriptive Statistics of Logit Model.
4 29 Table 16: Logistic Regression 29 Table A1: Top 20 Producers of Vegetables .. 33 Table A2: Top 20 Exporters of Vegetables .. 34 Table A3: Distribution of FARMERS by District .. 36 Table A4: Definition of Variables .. 36 Figure A 1: Map of Tanzania .. 35 3 LIST OF FIGURES Figure 1: Average Annual Production, 1990 2008 (metric tonnes) .. 5 Figure 2: Land and Implement Ownership .. 10 Figure 3: Main Sources of Income .. 11 Figure 4: Income Supplementation .. 11 Figure 5: Use of Family and Hired Labour .. 12 Figure 6: Supply Chain .. 17 Figure 7: Main Constraints Faced by Smallholder Horticultural FARMERS .
5 18 Figure 8: Other Constraints .. 19 Figure 9: Satisfaction with Quality of Extension Services .. 20 Figure 10: Ability to Meet Needs of Buyers .. 21 Figure 11: Whether Buyers are Satisfied with the Products (%).. 22 Figure 12: Main complaints from Buyers .. 23 Figure 13: Existence of Processing Firms and Percentage Selling to Them .. 24 Figure 14: Estimated Percentage Increase in Output if Processing Firms Existed .. 25 Figure 15: Percentage Share of FARMERS Who Sell to Foreign Firms and Ability to Meet their Standards .. 25 Figure 16: Availability of Export Information.
6 26 Figure 17: Membership to TAHA and 27 Figure 18: Percentage of FARMERS Considering Diversification .. 27 ABBREVIATIONS FAO Food and Agriculture Organisation TAHA Tanzania Horticulture Association URT United Republic of Tanzania UVIWA Ushirikiano wa Vijana na Wanawake wa Arumeru (Partnership for the Youth and Women of Arumeru) ROSCAS Rotating Savings and Credit Associations 4 1 THE BACKDROP It is no secret that the world has witnessed a rapid increase in demand and production of non . traditional horticulture products1 in recent years. The increase in production of non traditional horticultural product has been in response to the increase in demand and popularity of these products.
7 The increase in popularity has been due to the health awareness of people regarding the benefits of eating fruits and vegetables (Dolan and Humphrey, 2000). The increase in demand has also led to supermarkets taking a lead in stocking and sourcing vegetables and fruits from guaranteed sources in developing countries, in what is called global governance . In developed countries for example, the availability of fresh vegetables and fruits in supermarkets is almost taken for granted all year round (Dolan and Humphrey, 2000). On the production side, a key factor accounting for the increase in horticulture products is the rise in the number of supermarkets, which has made small scale producers in developing countries to rise to the challenge of supplying the supermarkets with non traditional horticulture products to meet the growing demand of consumers in the developed countries as well as in their own urban centres (see FAO, 2003).
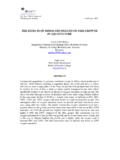
8 Tanzania's contribution in the global production of fresh vegetables shows that between 1990 and 2008, annual average growth rate of production was Production of fresh vegetables was highest in 1990 at 1 million tonnes, but it tapered off two years later to 800,000 tonnes. Between 1994 and 2001, production showed an increasing but fluctuating trend. From 2002 to 2008, production remained constant (FAO Website). Figure 1 shows the average annual production levels for selected countries including Tanzania. It shows that between 1990 and 2008, Tanzania was far ahead of the countries in terms of level of production, followed by Kenya.
9 Figure 1: Average Annual Production, 1990 2008 (metric tonnes) Source: 1. Non traditional horticulture products in this study are fresh fruits and vegetables. The study therefore leaves out flowers that are mostly produced by large scale FARMERS , and focuses only on vegetables. 5 While Tanzania's level of production of fresh vegetables is impressive, it does not do as well in the export market. Tanzania's position in international trade of horticultural products can be understood by looking at global ranking. In terms of production of fresh vegetables, Tanzania is among the top 20 countries (see Table 1A in the appendix).
10 In 2000, Tanzania was ranked 20th, but her position improved to 18th in 2007. However, when we look at exports, Tanzania does not appear among the top 20 exporters of fresh vegetables. Amazingly, Kenya, which does not appear among the top 20 producers, maintained her 6th position among the top 20 exporters of fresh vegetables in both periods shown (see Table A2 in the appendix). This shows that although Tanzania has a comparative advantage in producing agricultural based products, in this case, vegetables, it does not utilise this advantage in making an impact in the export market.