Transcription of Midterm Exam 1 Review — Chapters 1, 2, 4 and 5
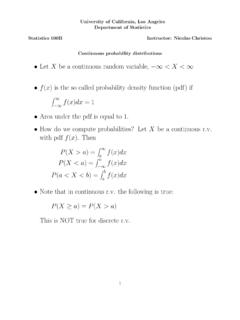
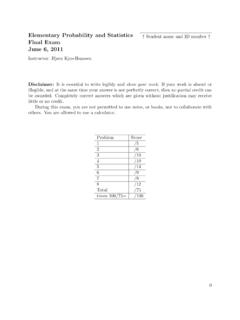
1 Stats 11(Fall 2004) Lecture NoteInstructor: Hongquan XuIntroduction to Statistical Methods for business and EconomicsMidterm Exam 1 Review Chapters 1, 2, 4 and 51. The histogram and boxplot of the exam scores for 60 students are given ScoreFrequency304050607080901000246810l3 0405060708090100(a) What is the overall shape of the distribution of the exam scores?(b) What proportion of students scored more than 90?(c) 25% of students scored more than.(d) What was the lowest score?(e)Based on the boxplot only, can you tell that the mean exam score was larger or less than themedian score? Explain A marketing research firm conducted a survey of companies in its state. They mailed a questionnaire to300 small companies, 300 medium-sized companies, and 300 large companies. The rate of nonresponseis important in deciding how reliable survey results are. Here are the data on response to this survey:ResponseSize of CompanyYesNoTotalSmall175125300 Medium145155300 Large120180300(a) Draw a bar graph to compare the nonresponse rates for the three size categories.
2 Label both axesclearly.(b) What is the overall nonresponse rate?(c) Given that a randomly selected company does not response to the survey, what is the probabilitythat this is a large company?(d) Are the variables response and size of company independent? You must fully explain youranswer for full A basketball player has made about 70% of his free throws over several years. Suppose that his freethrows are independent trials with probability of a success on each trial.(a) What is the probability that he makes none in 6 attempts?(b) What is the probability that he makes at least one in 6 attempts?4. A manufacturing process produces compact discs (CDs). It is known that 10% of the CD s producedare defective. A simple test is used to determine whether a CD is defective, for which 98% of thedefective CDs are detected and 5% of the good CDs are declared defective.(a) What is the probability that a randomly selected CD will be declared defective by the test?
3 Showall work.(b) Given that a randomly selected CD is declared defective by the test, what is the probability thatthe CD is truly defective? Show all LetXbe the number of persons living in an American household. Ignoring the few households withmore than seven inhabitants, the distribution ofXis as follows:Inhabitants123456 ?(a) What is the missing probabilityP(X= 7)?(b) What isP(2<X 4)?(c) What isP(X6= 1)?(d) What isP(X<4|X6= 1)?(e) What is the expected (mean) number of persons living in an American household?(f) What is the standard deviation of the number of persons living in an American household?Some important concepts for reviewDistinction between experiments and observational basic principles of design of of error in surveysRole of randomizationMeasures of centers and spread4 Midterm Exam 1 Time: Monday, October 25, in class (10-10:50) Material: Chapters 1, 2, 4 and 5 (including lectures, homework 1-3, labs 1-2) It will be aclosed book exam.
4 Bring your calculator, ruler, pen, pencil, eraser, :The following formulas will be Mean and Standard Deviationmean x=1n xi, standard deviations= 1n 1 (xi x)2 Probability RulesComplement Rule:P(Ac) = 1 P(A).Addition Rule:P(AorB) =P(A) +P(B) P(AandB).IfAandBare disjoint (mutually exclusive), thenP(AorB) =P(A) +P(B).Multiplication Rule:P(AandB) =P(A)P(B|A) =P(B)P(A|B)IfAandBare independent thenP(AandB) =P(A)P(B).Conditional Probability:P(A|B) =P(AandB)P(B)Partition Rule: IfA1,A2,..,Akform a partition,P(B) =P(B|A1)P(A1) +P(B|A2)P(A2) +..+P(B|Ak)P(Ak)Bayes Rule:P(A|B) =P(B|A)P(A)P(B)=P(B|A)P(A)P(B|A)P(A)+P(B |Ac)P(Ac).Random VariablesmeanE(X) = xf(x) and variance var (X) =E[(X E(X))2] =E(X2) [E(X)]2 Rules for expectation:E[g(X)] = g(x)f(x) andE[g1(X) +g2(X)] =E[g1(X)] +E[g2(X)]Rules for means:E(a+cX) =a+cE(X)Rules for variances: var (a+cX) =c2var (X)5