Transcription of MODULE 5: DISTILLATION
1 NPTEL Chemical Mass Transfer Operation 1 Joint initiative of IITs and IISc Funded by MHRD Page 1 of 9 MODULE 5: DISTILLATION LECTURE NO. 1 Introduction DISTILLATION is method of separation of components from a liquid mixture which depends on the differences in boiling points of the individual components and the distributions of the components between a liquid and gas phase in the mixture. The liquid mixture may have different boiling point characteristics depending on the concentrations of the components present in it. Therefore, DISTILLATION processes depends on the vapor pressure characteristics of liquid mixtures. The vapor pressure is created by supplying heat as separating agent.
2 In the DISTILLATION , the new phases differ from the original by their heat content. During most of the century, DISTILLATION was by far the most widely used method for separating liquid mixtures of chemical components (Seader and Henley, 1998). This is a very energy intensive technique, especially when the relative volatility of the components is low. It is mostly carried out in multi tray columns. Packed column with efficient structured packing has also led to increased use in DISTILLATION . Vapor Pressure Vapor Pressure: The vaporization process changes liquid to gaseous state. The opposite process of this vaporization is called condensation. At equilibrium, the rates of these two processes are same.
3 The pressure exerted by the vapor at this equilibrium state is termed as the vapor pressure of the liquid. It depends on the temperature and the quantity of the liquid and vapor. From the following Clausius-Clapeyron Equation or by using Antoine Equation, the vapor pressure can be calculated. NPTEL Chemical Mass Transfer Operation 1 Joint initiative of IITs and IISc Funded by MHRD Page 2 of 9 Clausius-Clapeyron Equation: TTRppvv11ln11 ( ) where vpand vp1 are the vapor pressures in Pascal at absolute temperature T and T1 in K. is the molar latent heat of vaporization which is independent of temperature. Antoine Equation: ln(Pascal)vBpATC ( ) Typical representative values of the constants A, B and C are given in the following Table (Ghosal et al.)
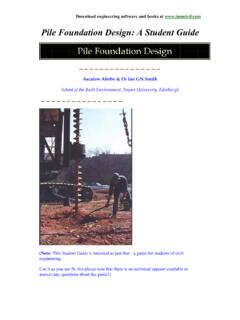
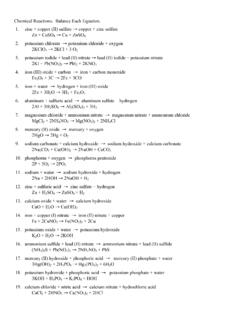
4 , 1993) Table : Typical representative values of the constants A, B and C Components Range of Temperature (T), K A B C Acetone 241-350 Ammonia 179-261 Benzene 280-377 Ethanol 270-369 Methanol 257-364 Toluene 280-410 Water 284-441 Readers are suggested to revise the thermodynamics for more about vapor pressure and boiling point. Phase Diagram For binary mixture phase diagram only two-component mixture, ( A (more volatile) and B (less volatile)) are considered. There are two types of phase diagram: constant pressure and constant temperature. Constant Pressure Phase Diagram The Figure shows a constant pressure phase diagram for an ideal solution (one that obeys Raoult's Law).
5 At constant pressure, depending on relative NPTEL Chemical Mass Transfer Operation 1 Joint initiative of IITs and IISc Funded by MHRD Page 3 of 9 concentrations of each component in the liquid, many boiling point temperatures are possible for mixture of liquids (solutions) as shown in phase disgram diagram (Figure ). For mixture, the temperature is called bubble point temperature when the liquid starts to boil and dew point when the vapor starts to condense. Boiling of a liquid mixture takes place over a range of boiling points. Likewise, condensation of a vapor mixture takes place over a range of condensation points. The upper curve in the boiling point diagram is called the dew-point curve (DPC) while the lower one is called the bubble-point curve (BPC).
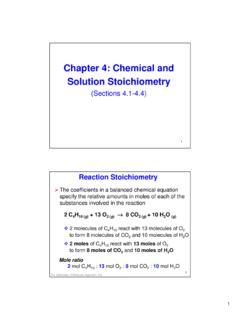
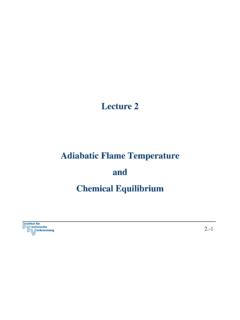
6 At each temperature, the vapor and the liquid are in equilibrium. The constant pressure phase diagram is more commonly used in the analysis of vapor-liquid equilibrium. Figure : Phase diagram of binary system at constant pressure Constant temperature (isothermal) phase diagram The constant temperature phase diagram is shown in Figure The constant temperature phase diagram is useful in the analysis of solution behaviour. The more volatile liquid will have a higher vapor pressure ( pA at xA = ) NPTEL Chemical Mass Transfer Operation 1 Joint initiative of IITs and IISc Funded by MHRD Page 4 of 9 Figure : Binary Phase diagram at constant temperature Relative volatility Relative volatility is a measure of the differences in volatility between two components, and hence their boiling points.
7 It indicates how easy or difficult a particular separation will be. The relative volatility of component A with respect to component B in a binary mixture is defined as BBAAAB xyxy// ( ) where, yA = mole fraction of component A in the vapor, xA = mole fraction of component A in the liquid. In general, relative volatility of a mixture changes with the mixture composition. For binary mixture, xB = 1-xA. So Equation ( ) can be rearranged, simplifying and expressed by dropping subscript 'A' for more volatile component as: xxyaveave)1(1 ( ) The Equation ( ) is a non-linear relationships between x and y. This Equation can be used to determine the equilibrium relationship (y vs. x) provided the NPTEL Chemical Mass Transfer Operation 1 Joint initiative of IITs and IISc Funded by MHRD Page 5 of 9 average relative volatility, ave is known.
8 If the system obeys Raoult s law, AAPyp , BBPyp , the relative volatility can be expressed as: BBAAAB xpxp// ( ) where pA is the partial pressure of component A in the vapor, pB is the partial pressure of component B in the vapor and P is the total pressure of the system. Thus if the relative volatility between two components is equal to one, separation is not possible by DISTILLATION . The larger the value of , above , the greater the degree of separability, the easier the separation. Some examples of optimal relative volatility that are used for DISTILLATION process design are given in Table Table : Some optimal relative volatility that are used for DISTILLATION process design More volatile component (normal boiling point oC) Less boiling component (normal boiling point, oC) Optimal Relative volatility Benzene ( ) Toluene ( ) Toluene ( ) p-Xylene ( ) Benzene ( ) p-Xylene ( ) m-Xylene ( ) p-Xylene ( ) Pentane ( ) Hexane ( ) Hexane ( ) Heptane ( ) Hexane ( ) p-Xylene ( ) Ethanol ( ) iso-Propanol ( ) iso-Propanol ( ) n-Propanol ( ) Ethanol ( ) n-Propanol ( ) Methanol ( ) Ethanol ( ) Methanol ( ) iso-Propanol ( ) Chloroform ( ) Acetic acid ( ) Vapor-Liquid Equilibrium (VLE) It is useful for graphical design in determining the number of theoretical stages required for a DISTILLATION column.
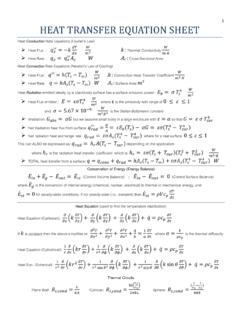
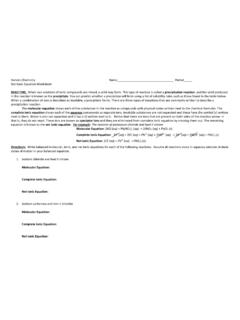
9 A typical equilibrium curve for a binary mixture on x-y plot is shown in Figure It can be plotted by the equations ( ) or ( ) as discussed earlier section. It contains less information than the phase diagram ( temperature is not included), but it is most commonly used. The VLE plot NPTEL Chemical Mass Transfer Operation 1 Joint initiative of IITs and IISc Funded by MHRD Page 6 of 9 expresses the bubble-point and the dew-point of a binary mixture at constant pressure. The curved line in Figure is called the equilibrium line and it describes the compositions of the liquid and vapor in equilibrium at some fixed pressure. The equilibrium line can be obtained from the Equation ( ) once the relative volatility is known.
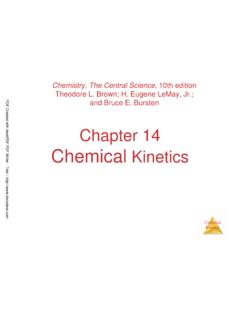
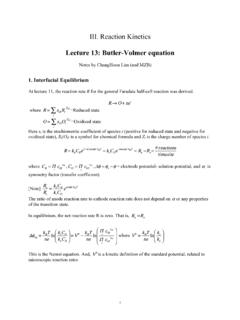
10 Figure : Equilibrium diagram for a benzene-toluene mixture at 1 atmosphere This particular VLE plot (Figure ) shows a binary ideal mixture that has a uniform vapor-liquid equilibrium that is relatively easy to separate. On the other hand, the VLE plots shown in Figure represented for non-ideal systems. These non-ideal VLE systems will present more difficult separation. y = + + = fraction of benzene in vapour, yMole fraction of benzene in liquid , xEquilibrium curve45odiagonal lineNPTEL Chemical Mass Transfer Operation 1 Joint initiative of IITs and IISc Funded by MHRD Page 7 of 9 Figure : Vapor-liquid equilibrium curve for non-ideal systems The most challenging VLE curves are generated by azeotropic systems.