Transcription of Module 5b: Pre- and Post-testing for Student Learning
1 Module 5b: Pre-and Post-testing for Student LearningPassport to Great Teaching Creative AssessmentTimothy S. Brophy The Value of Pre-and post -TestingPre- and Post-testing , when done well, can yield valuable data for teacher useThe process starts with the administration of a test of the knowledge and/or skills to be taught/refined at the beginning of a sequence of instructionThe process continues with the administration of the same test at the end of a sequence of instructionThe process ends with an analysis of the difference between the Student s test scores or performance at these two points in timeStudent LearningA primary reason for pre- and Post-testing is to determine the
2 Degree to which students have learned the content or skill area of interestStudent Learning can be inferred from the difference in Student performance between two points in timeThe degree to which Learning can be measured depends on many things such as the amount (minutes, days) and quality of instruction between the two points in timePre-testingMost teachers develop their own tests and performance assessmentsIn some cases, a third-party test one developed by an individual or organization other than the teacher is used (for example, ETS field tests)
3 In the pre-test phase, the teacher administers the test and records Student data to guide instruction and for later analysisPost-testingWhen the instructional period is complete, the teacher administers the same testThe is the Post-testing phaseThe Student achievement data is recorded for each studentThis data can be analyzed comparatively in two ways: one is by a qualitative review, the other is usually via a paired-samples t-testQualitative AnalysisA qualitative analysis consists of a review of the scores or performance data with the teacher noting changes in the results over timeUsing professional judgment, the teacher determines the degree to which students have learned content or improved their skills by comparing the two sets of scores qualitativelySome guiding questions are: 1.
4 How many students increased their scores? 2. How many did not?3. How large are the differences between the scores? 4. What does this tell you about Student growth and the effectiveness of instruction?The teacher uses this analysis to modify and improve instructionQuantitative AnalysisTeachers know that pre-and post -test scores on an assessment are different; if teaching has resulted in the expected Learning , post -test scores should be higherIn addition to a qualitative review, it can be useful to review the statistical relationship between the pre-and post -test scoresWhen the data permit, we can use the paired samples t- test to determine if the difference between pre-and post -test scores is significantQuantitative Analysis Paired samples t-testPaired samples t-test a statistical test of the difference between a set of paired samples.
5 Such as pre-and post -test scores. This is sometimes called the dependent samples t-test. For every observed change in one Student s pre-test score, there is an expected change in that Student s post -test score. For this test, the null hypothesis is that there are no differencesbetween the scores. The paired samples t-test provides an estimate of the significance of the difference between the means of the two samples from the same subjects in this case, the pre-and post -tests of the students in a class.
6 The p-valuethat the test provides gives us information that allows us to accept or reject the null the test is significant at p< .05, we can reject the null hypothesis and ascertain that the pre- and post -test differences are different, and the differences is not caused by chance. Quantitative Analysis Paired Samples t-testTo use the paired samples t-test correctly, the measurement must yield continuous, interval data , scores derived from a point scale where the points are equidistant (the distance between the points does not vary)An example of interval measurement is a ruler the distances between the points of measurement ( , inches or millimeters) do not varyInterval scales are most familiar when used to measure achievement on a test.
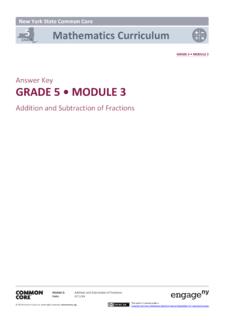
7 For example, a test with 50 questions each worth two points is worth a total of 100 points. The points earned form the test-takers score. Because the points are equal in value and represent the test takers amount of knowledge it is assumed that higher scores represent higher knowledge attainment. Let s work an example: Qualitative Analysis Here are pre- and post -test scores for a group of 22 students on a mathematics quiz (max. score = 50). Pause the video and review these. The mean score on the pre-test is ; the mean score on the post -test is What does your qualitative analysis reveal?
8 StudentPre-testPost-testJohn2838 Tim2435 Anne3137 Charles2134 Chrissy4649 Bernard5045 LaShawn4744 Kimara1830 Robb1725 Pooja4545 Charlie3035 Hadley4250 Parker4440 Emmy3233 Lily2540 Joe1510 Harper3534 DeJuan2334 Antonio4546 Mariadela2040 Tony3029 Tom4950 Let s work an example: Quantitative Analysis Here are the same two sets of scores. These two sets of scores can be analyzed with the Paired samples t-test because the scores are based on an interval scale of 50 it out! To analyze this, open this free online paired-samples t-test calculator in a new window.
9 Cut and paste the pre-test scores in treatment 1 column, and the post -test scores in the treatment 2 column. Be sure that the significance level is .05 and the hypothesis is two-tailed. You might want to pause the video while you do this. Find the t value at the bottom of the page, and the significance calculation or p value. Interpreting the coefficientThe t value is which rounds to The significance value is p < .05. This means that for this setof scores, there is a difference between the pre-test (mean ) and post -test (mean ) scores that is not likely due to chance.
10 Therefore,the teacher can conclude that the instruction was effective and that the students know more than they did at the beginning of the instruction. TriangulationMost teachers find the best information when they triangulate their analyses to obtain a complete picture of Student growthWhen there is both a qualitative and quantitative analysis of pre-and post -test data, teachers obtain a better idea of Student learningThe qualitative analysis of these test scores revealed that 19 of the 22 students earned a higher post -test scoreThe quantitative analysis supports this with a significant paired samples t-test which we would expect if 19 of the 22 in the class increased their to Practice You will analyze a set of pre- and post -test scores on a chemistry test qualitatively and quantitatively.