Transcription of Monthly export statistics - August 2018 In thousand 60kg ...
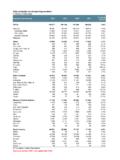
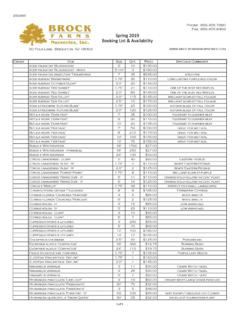
1 Monthly export statistics - July 2018. In thousand 60kg bags July 2017 July 2018 % change October - July 2016/17 2017/18 % change TOTAL 9 663 10 111 100 335 101 197 Arabicas 5 850 6 119 63 849 63 389 Colombian Milds 1 090 1 177 12 249 11 660 Other Milds 2 630 2 566 22 900 23 691 Brazilian Naturals 2 131 2 375 28 700 28 039 Robustas 3 813 3 992 36 486 37 808 Angola 1 1 12 4 Bolivia 0 0 16 18 Brazil 1 873 2 326 26 880 25 794 Burundi 6 11 186 144 Cameroon 22 22 179 237 Central African Republic 0 0 17 42 Congo, Dem. Rep. of 12 15 100 126 Colombia 1 001 1 076 11 171 10 568 Costa Rica 106 123 892 1 018 C te d'Ivoire 118 183 821 972 Cuba 1 1 13 8 Dominican Republic 1 2 21 15 Ecuador 69 29 681 455 El Salvador 67 58 426 512 Ethiopia 365 422 2 836 3 077 Gabon 0 0 0 0.
2 Ghana 0 1 5 5 Guatemala 374 350 2 695 2 884 Honduras 771 688 6 627 6 444 India 546 409 5 245 5 570 Indonesia 916 550 7 057 4 688 Jamaica 2 2 7 8 Kenya 75 81 642 600 Liberia 1 0 1 5 Madagascar 4 4 62 42 Malawi 1 1 14 9 Mexico 248 275 2 333 2 787 Nepal 0 0 1 1 Nicaragua 244 273 2 016 2 167 Panama 7 6 43 32 Papua New Guinea 87 100 794 575 Paraguay 0 0 0 0. Peru 360 333 2 831 2 804 Philippines 1 0 13 2 Rwanda 17 17 201 185 Sierra Leone 5 4 25 27 Tanzania 16 54 655 680 Thailand 12 16 114 147 Timor-Leste 3 3 87 50 Togo 1 4 24 57 Uganda 427 393 3 845 3 717 Venezuela 0 0 0 0. Vietnam 1 837 2 217 20 243 24 197 Yemen 4 4 36 38 Zambia 1 0 13 11 Zimbabwe 0 0 5 2 Others 60 57 452 471 Note: Group sub-totals take into account the corresponding share of each type of coffee exported by countries that produce and export both Arabica and robusta in significant volumes.
3 It should be noted that, where applicable, an Arabica/ robusta ratio of 50/50 has been used to convert processed coffee into Green Bean Equivalent (GBE). A figure of 0 in the table can mean a volume of less than 500 bags, due to rounding. Full data in Excel format are available to paid subscribers Next update: 1 October 2018. International Coffee Organizatio